Ottawa vs Houma Unemployment Among Ages 60 to 64 years
COMPARE
Ottawa
Houma
Unemployment Among Ages 60 to 64 years
Unemployment Among Ages 60 to 64 years Comparison
Ottawa
Houma
4.9%
UNEMPLOYMENT AMONG AGES 60 TO 64 YEARS
11.6/ 100
METRIC RATING
220th/ 347
METRIC RANK
4.9%
UNEMPLOYMENT AMONG AGES 60 TO 64 YEARS
28.3/ 100
METRIC RATING
193rd/ 347
METRIC RANK
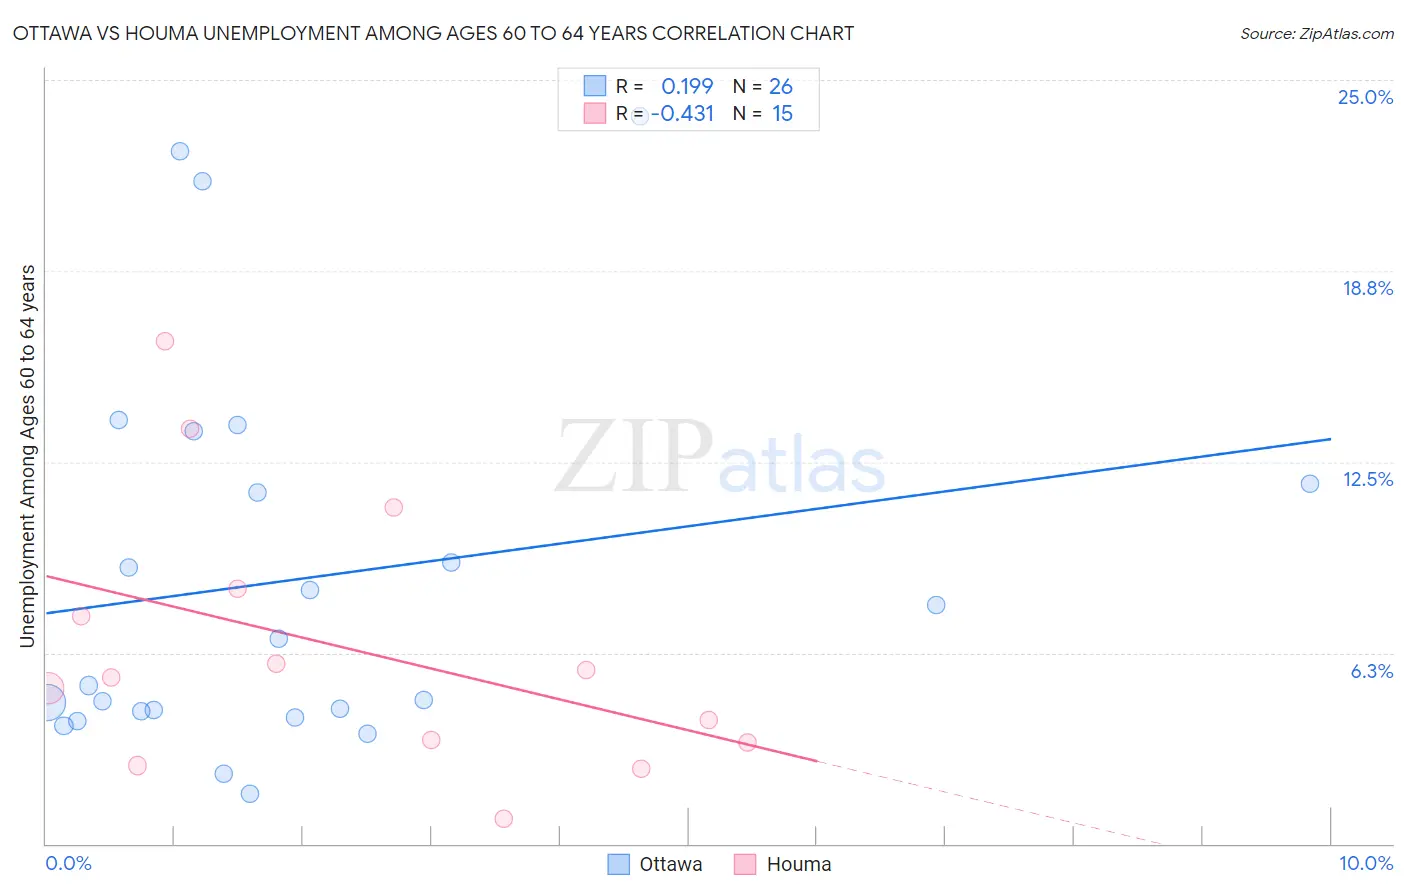
Ottawa vs Houma Unemployment Among Ages 60 to 64 years Correlation Chart
The statistical analysis conducted on geographies consisting of 47,404,743 people shows a poor positive correlation between the proportion of Ottawa and unemployment rate among population between the ages 60 and 64 in the United States with a correlation coefficient (R) of 0.199 and weighted average of 4.9%. Similarly, the statistical analysis conducted on geographies consisting of 35,391,990 people shows a moderate negative correlation between the proportion of Houma and unemployment rate among population between the ages 60 and 64 in the United States with a correlation coefficient (R) of -0.431 and weighted average of 4.9%, a difference of 0.96%.
Unemployment Among Ages 60 to 64 years Correlation Summary
| Measurement | Ottawa | Houma |
| Minimum | 1.7% | 0.80% |
| Maximum | 23.8% | 16.4% |
| Range | 22.1% | 15.6% |
| Mean | 8.7% | 6.4% |
| Median | 5.9% | 5.4% |
| Interquartile 25% (IQ1) | 4.3% | 3.3% |
| Interquartile 75% (IQ3) | 11.8% | 8.3% |
| Interquartile Range (IQR) | 7.5% | 5.0% |
| Standard Deviation (Sample) | 6.3% | 4.4% |
| Standard Deviation (Population) | 6.2% | 4.2% |
Similar Demographics by Unemployment Among Ages 60 to 64 years
Demographics Similar to Ottawa by Unemployment Among Ages 60 to 64 years
In terms of unemployment among ages 60 to 64 years, the demographic groups most similar to Ottawa are Immigrants from Brazil (4.9%, a difference of 0.010%), Immigrants from Singapore (4.9%, a difference of 0.040%), Korean (4.9%, a difference of 0.050%), Cajun (4.9%, a difference of 0.060%), and Ugandan (4.9%, a difference of 0.10%).
| Demographics | Rating | Rank | Unemployment Among Ages 60 to 64 years |
| Eastern Europeans | 14.3 /100 | #213 | Poor 4.9% |
| Immigrants | Russia | 13.7 /100 | #214 | Poor 4.9% |
| Immigrants | South Eastern Asia | 13.1 /100 | #215 | Poor 4.9% |
| Cajuns | 12.3 /100 | #216 | Poor 4.9% |
| Koreans | 12.2 /100 | #217 | Poor 4.9% |
| Immigrants | Singapore | 12.0 /100 | #218 | Poor 4.9% |
| Immigrants | Brazil | 11.7 /100 | #219 | Poor 4.9% |
| Ottawa | 11.6 /100 | #220 | Poor 4.9% |
| Ugandans | 10.5 /100 | #221 | Poor 4.9% |
| Brazilians | 10.1 /100 | #222 | Poor 5.0% |
| Crow | 9.7 /100 | #223 | Tragic 5.0% |
| Immigrants | Cameroon | 8.5 /100 | #224 | Tragic 5.0% |
| Immigrants | Ireland | 7.2 /100 | #225 | Tragic 5.0% |
| Immigrants | Chile | 6.8 /100 | #226 | Tragic 5.0% |
| Nigerians | 6.8 /100 | #227 | Tragic 5.0% |
Demographics Similar to Houma by Unemployment Among Ages 60 to 64 years
In terms of unemployment among ages 60 to 64 years, the demographic groups most similar to Houma are Menominee (4.9%, a difference of 0.020%), Immigrants from Nigeria (4.9%, a difference of 0.050%), Immigrants from Nicaragua (4.9%, a difference of 0.060%), Immigrants from Europe (4.9%, a difference of 0.060%), and Immigrants from Colombia (4.9%, a difference of 0.070%).
| Demographics | Rating | Rank | Unemployment Among Ages 60 to 64 years |
| Spaniards | 35.8 /100 | #186 | Fair 4.9% |
| South American Indians | 31.2 /100 | #187 | Fair 4.9% |
| Nicaraguans | 30.4 /100 | #188 | Fair 4.9% |
| Immigrants | Nicaragua | 29.8 /100 | #189 | Fair 4.9% |
| Immigrants | Europe | 29.8 /100 | #190 | Fair 4.9% |
| Immigrants | Nigeria | 29.6 /100 | #191 | Fair 4.9% |
| Menominee | 28.8 /100 | #192 | Fair 4.9% |
| Houma | 28.3 /100 | #193 | Fair 4.9% |
| Immigrants | Colombia | 26.8 /100 | #194 | Fair 4.9% |
| Immigrants | Austria | 26.6 /100 | #195 | Fair 4.9% |
| Immigrants | Asia | 25.7 /100 | #196 | Fair 4.9% |
| Immigrants | Eastern Europe | 25.2 /100 | #197 | Fair 4.9% |
| Guamanians/Chamorros | 23.7 /100 | #198 | Fair 4.9% |
| Immigrants | Vietnam | 23.7 /100 | #199 | Fair 4.9% |
| Immigrants | Czechoslovakia | 23.5 /100 | #200 | Fair 4.9% |