Immigrants from Africa vs Menominee Median Family Income
COMPARE
Immigrants from Africa
Menominee
Median Family Income
Median Family Income Comparison
Immigrants from Africa
Menominee
$100,256
MEDIAN FAMILY INCOME
22.5/ 100
METRIC RATING
198th/ 347
METRIC RANK
$79,563
MEDIAN FAMILY INCOME
0.0/ 100
METRIC RATING
334th/ 347
METRIC RANK
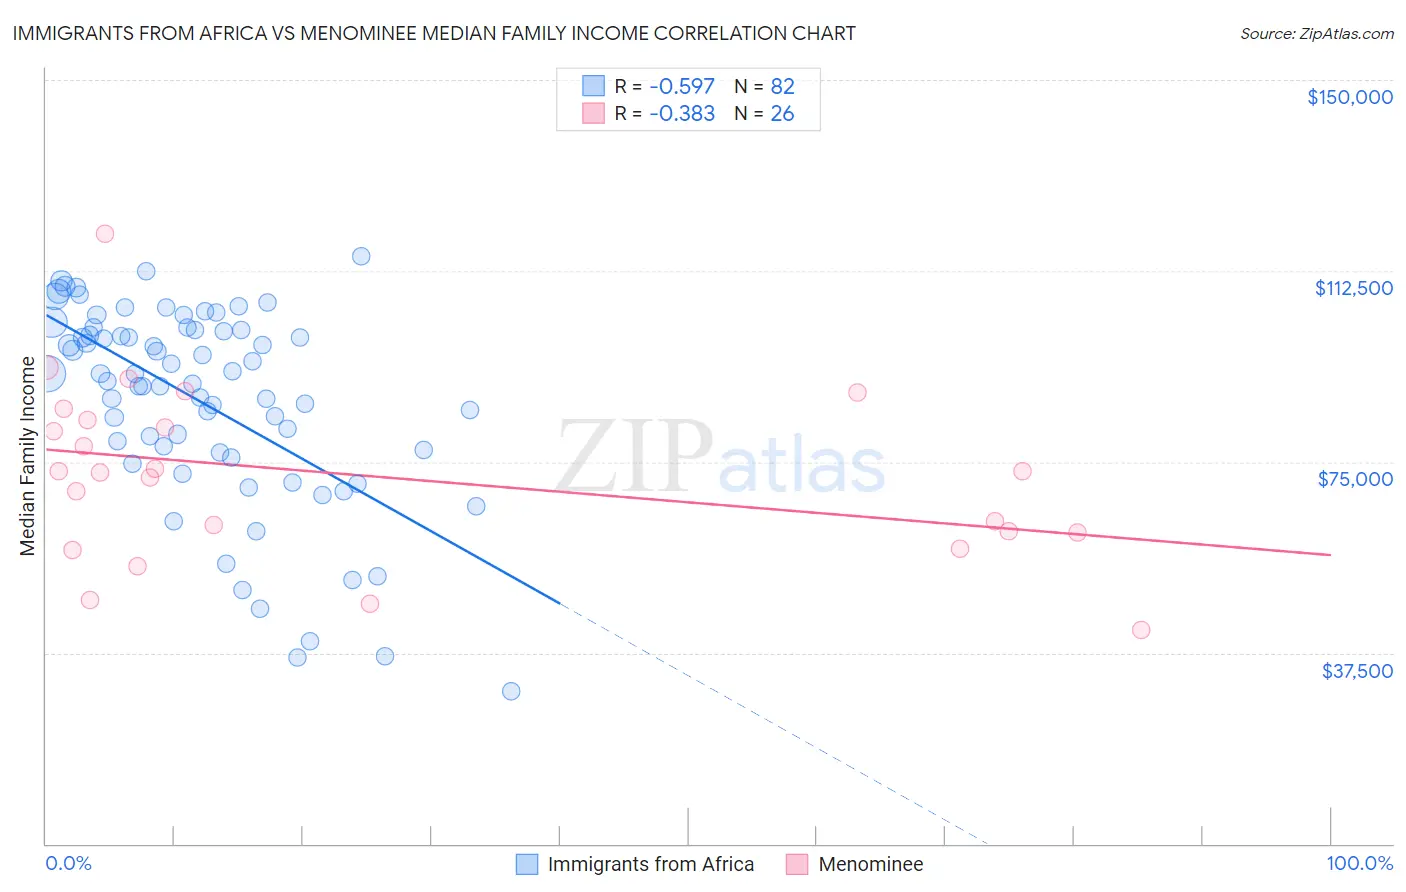
Immigrants from Africa vs Menominee Median Family Income Correlation Chart
The statistical analysis conducted on geographies consisting of 468,709,431 people shows a substantial negative correlation between the proportion of Immigrants from Africa and median family income in the United States with a correlation coefficient (R) of -0.597 and weighted average of $100,256. Similarly, the statistical analysis conducted on geographies consisting of 45,777,534 people shows a mild negative correlation between the proportion of Menominee and median family income in the United States with a correlation coefficient (R) of -0.383 and weighted average of $79,563, a difference of 26.0%.
Median Family Income Correlation Summary
| Measurement | Immigrants from Africa | Menominee |
| Minimum | $29,978 | $41,944 |
| Maximum | $115,502 | $119,750 |
| Range | $85,524 | $77,806 |
| Mean | $86,633 | $72,340 |
| Median | $91,514 | $72,940 |
| Interquartile 25% (IQ1) | $76,824 | $61,250 |
| Interquartile 75% (IQ3) | $100,972 | $83,264 |
| Interquartile Range (IQR) | $24,148 | $22,014 |
| Standard Deviation (Sample) | $19,648 | $17,229 |
| Standard Deviation (Population) | $19,528 | $16,895 |
Similar Demographics by Median Family Income
Demographics Similar to Immigrants from Africa by Median Family Income
In terms of median family income, the demographic groups most similar to Immigrants from Africa are Immigrants from Cameroon ($100,289, a difference of 0.030%), Samoan ($100,344, a difference of 0.090%), Yugoslavian ($100,119, a difference of 0.14%), Immigrants from South America ($100,414, a difference of 0.16%), and Spanish ($99,977, a difference of 0.28%).
| Demographics | Rating | Rank | Median Family Income |
| Colombians | 27.2 /100 | #191 | Fair $100,750 |
| Immigrants | Kenya | 26.5 /100 | #192 | Fair $100,679 |
| Iraqis | 26.3 /100 | #193 | Fair $100,658 |
| Uruguayans | 26.3 /100 | #194 | Fair $100,656 |
| Immigrants | South America | 23.9 /100 | #195 | Fair $100,414 |
| Samoans | 23.3 /100 | #196 | Fair $100,344 |
| Immigrants | Cameroon | 22.8 /100 | #197 | Fair $100,289 |
| Immigrants | Africa | 22.5 /100 | #198 | Fair $100,256 |
| Yugoslavians | 21.3 /100 | #199 | Fair $100,119 |
| Spanish | 20.1 /100 | #200 | Fair $99,977 |
| Immigrants | Thailand | 19.0 /100 | #201 | Poor $99,840 |
| Whites/Caucasians | 18.7 /100 | #202 | Poor $99,800 |
| Scotch-Irish | 17.1 /100 | #203 | Poor $99,591 |
| Ghanaians | 12.6 /100 | #204 | Poor $98,877 |
| Hawaiians | 12.5 /100 | #205 | Poor $98,869 |
Demographics Similar to Menominee by Median Family Income
In terms of median family income, the demographic groups most similar to Menominee are Yup'ik ($79,290, a difference of 0.34%), Kiowa ($80,885, a difference of 1.7%), Immigrants from Cuba ($78,249, a difference of 1.7%), Native/Alaskan ($80,908, a difference of 1.7%), and Yuman ($78,055, a difference of 1.9%).
| Demographics | Rating | Rank | Median Family Income |
| Arapaho | 0.0 /100 | #327 | Tragic $82,064 |
| Blacks/African Americans | 0.0 /100 | #328 | Tragic $81,912 |
| Dutch West Indians | 0.0 /100 | #329 | Tragic $81,852 |
| Cheyenne | 0.0 /100 | #330 | Tragic $81,385 |
| Immigrants | Dominican Republic | 0.0 /100 | #331 | Tragic $81,233 |
| Natives/Alaskans | 0.0 /100 | #332 | Tragic $80,908 |
| Kiowa | 0.0 /100 | #333 | Tragic $80,885 |
| Menominee | 0.0 /100 | #334 | Tragic $79,563 |
| Yup'ik | 0.0 /100 | #335 | Tragic $79,290 |
| Immigrants | Cuba | 0.0 /100 | #336 | Tragic $78,249 |
| Yuman | 0.0 /100 | #337 | Tragic $78,055 |
| Immigrants | Yemen | 0.0 /100 | #338 | Tragic $77,457 |
| Pima | 0.0 /100 | #339 | Tragic $77,431 |
| Hopi | 0.0 /100 | #340 | Tragic $77,188 |
| Pueblo | 0.0 /100 | #341 | Tragic $76,880 |