Apache vs Menominee Median Family Income
COMPARE
Apache
Menominee
Median Family Income
Median Family Income Comparison
Apache
Menominee
$84,451
MEDIAN FAMILY INCOME
0.0/ 100
METRIC RATING
315th/ 347
METRIC RANK
$79,563
MEDIAN FAMILY INCOME
0.0/ 100
METRIC RATING
334th/ 347
METRIC RANK
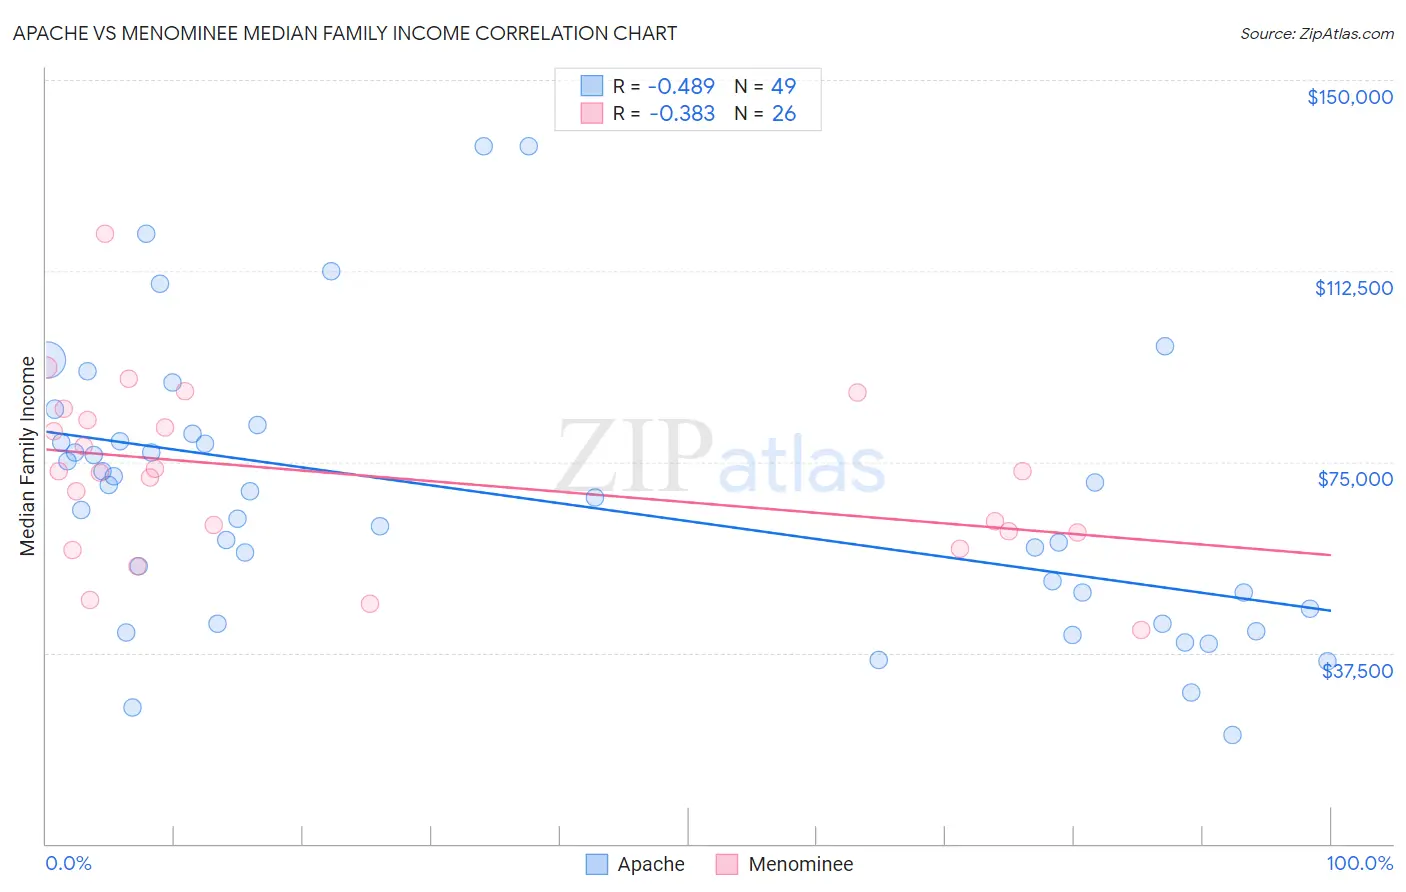
Apache vs Menominee Median Family Income Correlation Chart
The statistical analysis conducted on geographies consisting of 231,007,077 people shows a moderate negative correlation between the proportion of Apache and median family income in the United States with a correlation coefficient (R) of -0.489 and weighted average of $84,451. Similarly, the statistical analysis conducted on geographies consisting of 45,777,534 people shows a mild negative correlation between the proportion of Menominee and median family income in the United States with a correlation coefficient (R) of -0.383 and weighted average of $79,563, a difference of 6.1%.
Median Family Income Correlation Summary
| Measurement | Apache | Menominee |
| Minimum | $21,444 | $41,944 |
| Maximum | $136,944 | $119,750 |
| Range | $115,500 | $77,806 |
| Mean | $67,810 | $72,340 |
| Median | $68,015 | $72,940 |
| Interquartile 25% (IQ1) | $44,680 | $61,250 |
| Interquartile 75% (IQ3) | $79,729 | $83,264 |
| Interquartile Range (IQR) | $35,049 | $22,014 |
| Standard Deviation (Sample) | $26,784 | $17,229 |
| Standard Deviation (Population) | $26,510 | $16,895 |
Demographics Similar to Apache and Menominee by Median Family Income
In terms of median family income, the demographic groups most similar to Apache are Immigrants from Bahamas ($84,732, a difference of 0.33%), Immigrants from Haiti ($84,018, a difference of 0.52%), Yakama ($83,932, a difference of 0.62%), Immigrants from Mexico ($83,639, a difference of 0.97%), and Immigrants from Honduras ($83,618, a difference of 1.0%). Similarly, the demographic groups most similar to Menominee are Kiowa ($80,885, a difference of 1.7%), Native/Alaskan ($80,908, a difference of 1.7%), Immigrants from Dominican Republic ($81,233, a difference of 2.1%), Cheyenne ($81,385, a difference of 2.3%), and Dutch West Indian ($81,852, a difference of 2.9%).
| Demographics | Rating | Rank | Median Family Income |
| Immigrants | Bahamas | 0.0 /100 | #314 | Tragic $84,732 |
| Apache | 0.0 /100 | #315 | Tragic $84,451 |
| Immigrants | Haiti | 0.0 /100 | #316 | Tragic $84,018 |
| Yakama | 0.0 /100 | #317 | Tragic $83,932 |
| Immigrants | Mexico | 0.0 /100 | #318 | Tragic $83,639 |
| Immigrants | Honduras | 0.0 /100 | #319 | Tragic $83,618 |
| Seminole | 0.0 /100 | #320 | Tragic $83,354 |
| Immigrants | Caribbean | 0.0 /100 | #321 | Tragic $83,319 |
| Dominicans | 0.0 /100 | #322 | Tragic $82,888 |
| Bahamians | 0.0 /100 | #323 | Tragic $82,631 |
| Creek | 0.0 /100 | #324 | Tragic $82,560 |
| Sioux | 0.0 /100 | #325 | Tragic $82,386 |
| Immigrants | Congo | 0.0 /100 | #326 | Tragic $82,216 |
| Arapaho | 0.0 /100 | #327 | Tragic $82,064 |
| Blacks/African Americans | 0.0 /100 | #328 | Tragic $81,912 |
| Dutch West Indians | 0.0 /100 | #329 | Tragic $81,852 |
| Cheyenne | 0.0 /100 | #330 | Tragic $81,385 |
| Immigrants | Dominican Republic | 0.0 /100 | #331 | Tragic $81,233 |
| Natives/Alaskans | 0.0 /100 | #332 | Tragic $80,908 |
| Kiowa | 0.0 /100 | #333 | Tragic $80,885 |
| Menominee | 0.0 /100 | #334 | Tragic $79,563 |