Immigrants from Western Asia vs Menominee Median Family Income
COMPARE
Immigrants from Western Asia
Menominee
Median Family Income
Median Family Income Comparison
Immigrants from Western Asia
Menominee
$108,691
MEDIAN FAMILY INCOME
95.6/ 100
METRIC RATING
111th/ 347
METRIC RANK
$79,563
MEDIAN FAMILY INCOME
0.0/ 100
METRIC RATING
334th/ 347
METRIC RANK
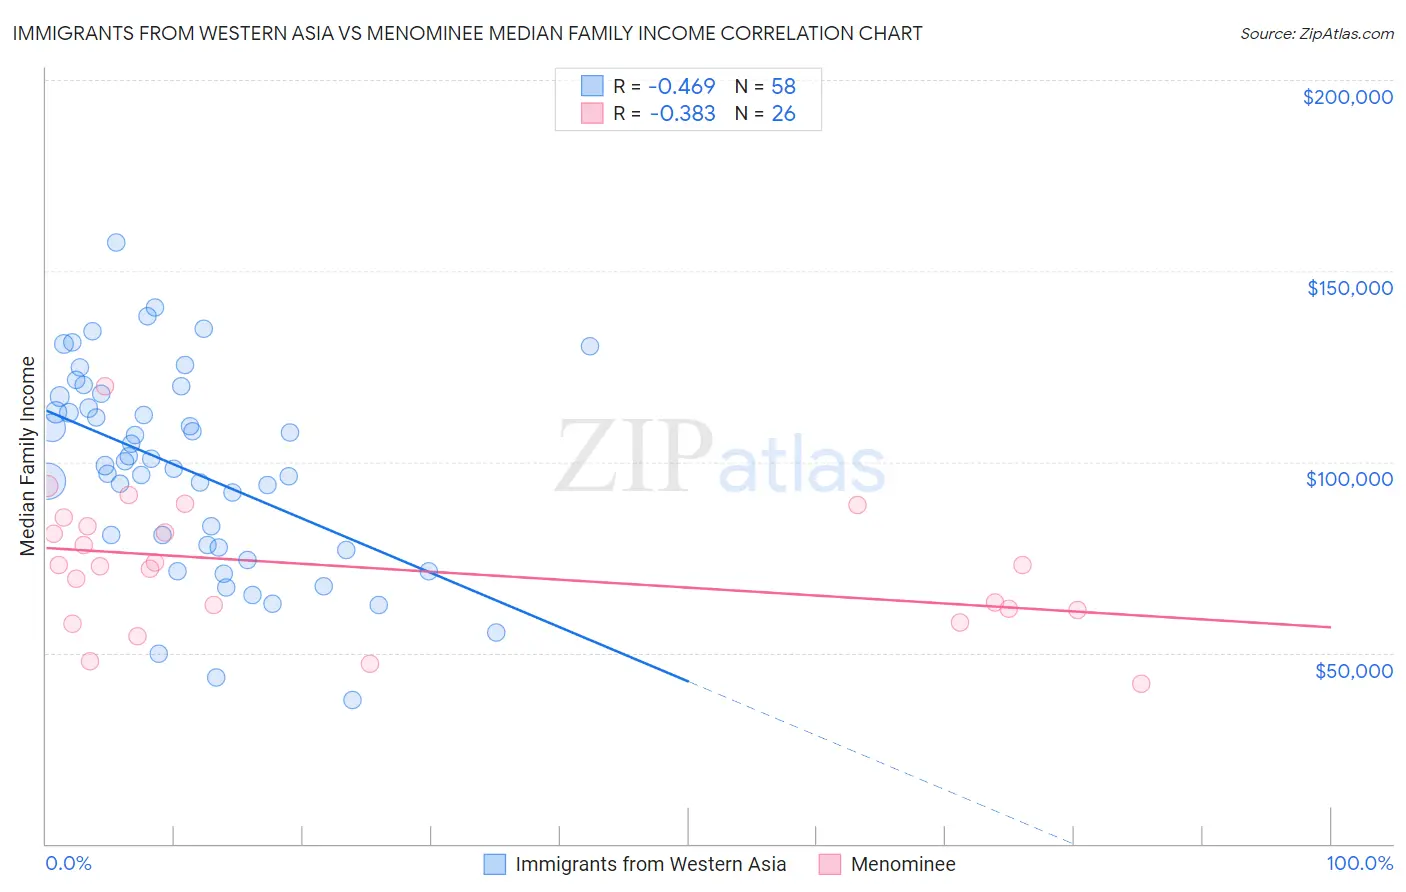
Immigrants from Western Asia vs Menominee Median Family Income Correlation Chart
The statistical analysis conducted on geographies consisting of 404,054,166 people shows a moderate negative correlation between the proportion of Immigrants from Western Asia and median family income in the United States with a correlation coefficient (R) of -0.469 and weighted average of $108,691. Similarly, the statistical analysis conducted on geographies consisting of 45,777,534 people shows a mild negative correlation between the proportion of Menominee and median family income in the United States with a correlation coefficient (R) of -0.383 and weighted average of $79,563, a difference of 36.6%.
Median Family Income Correlation Summary
| Measurement | Immigrants from Western Asia | Menominee |
| Minimum | $37,540 | $41,944 |
| Maximum | $157,455 | $119,750 |
| Range | $119,915 | $77,806 |
| Mean | $98,085 | $72,340 |
| Median | $99,522 | $72,940 |
| Interquartile 25% (IQ1) | $77,576 | $61,250 |
| Interquartile 75% (IQ3) | $117,037 | $83,264 |
| Interquartile Range (IQR) | $39,461 | $22,014 |
| Standard Deviation (Sample) | $26,265 | $17,229 |
| Standard Deviation (Population) | $26,038 | $16,895 |
Similar Demographics by Median Family Income
Demographics Similar to Immigrants from Western Asia by Median Family Income
In terms of median family income, the demographic groups most similar to Immigrants from Western Asia are British ($108,705, a difference of 0.010%), Immigrants from Afghanistan ($108,709, a difference of 0.020%), Immigrants from Poland ($108,570, a difference of 0.11%), Immigrants from Zimbabwe ($108,830, a difference of 0.13%), and Immigrants from Saudi Arabia ($108,544, a difference of 0.14%).
| Demographics | Rating | Rank | Median Family Income |
| Palestinians | 96.9 /100 | #104 | Exceptional $109,413 |
| Syrians | 96.7 /100 | #105 | Exceptional $109,299 |
| Albanians | 96.4 /100 | #106 | Exceptional $109,136 |
| Immigrants | North Macedonia | 96.4 /100 | #107 | Exceptional $109,136 |
| Immigrants | Zimbabwe | 95.9 /100 | #108 | Exceptional $108,830 |
| Immigrants | Afghanistan | 95.6 /100 | #109 | Exceptional $108,709 |
| British | 95.6 /100 | #110 | Exceptional $108,705 |
| Immigrants | Western Asia | 95.6 /100 | #111 | Exceptional $108,691 |
| Immigrants | Poland | 95.3 /100 | #112 | Exceptional $108,570 |
| Immigrants | Saudi Arabia | 95.2 /100 | #113 | Exceptional $108,544 |
| Poles | 95.2 /100 | #114 | Exceptional $108,507 |
| Swedes | 95.1 /100 | #115 | Exceptional $108,499 |
| Chileans | 95.0 /100 | #116 | Exceptional $108,429 |
| Immigrants | Philippines | 94.6 /100 | #117 | Exceptional $108,288 |
| Ethiopians | 94.5 /100 | #118 | Exceptional $108,251 |
Demographics Similar to Menominee by Median Family Income
In terms of median family income, the demographic groups most similar to Menominee are Yup'ik ($79,290, a difference of 0.34%), Kiowa ($80,885, a difference of 1.7%), Immigrants from Cuba ($78,249, a difference of 1.7%), Native/Alaskan ($80,908, a difference of 1.7%), and Yuman ($78,055, a difference of 1.9%).
| Demographics | Rating | Rank | Median Family Income |
| Arapaho | 0.0 /100 | #327 | Tragic $82,064 |
| Blacks/African Americans | 0.0 /100 | #328 | Tragic $81,912 |
| Dutch West Indians | 0.0 /100 | #329 | Tragic $81,852 |
| Cheyenne | 0.0 /100 | #330 | Tragic $81,385 |
| Immigrants | Dominican Republic | 0.0 /100 | #331 | Tragic $81,233 |
| Natives/Alaskans | 0.0 /100 | #332 | Tragic $80,908 |
| Kiowa | 0.0 /100 | #333 | Tragic $80,885 |
| Menominee | 0.0 /100 | #334 | Tragic $79,563 |
| Yup'ik | 0.0 /100 | #335 | Tragic $79,290 |
| Immigrants | Cuba | 0.0 /100 | #336 | Tragic $78,249 |
| Yuman | 0.0 /100 | #337 | Tragic $78,055 |
| Immigrants | Yemen | 0.0 /100 | #338 | Tragic $77,457 |
| Pima | 0.0 /100 | #339 | Tragic $77,431 |
| Hopi | 0.0 /100 | #340 | Tragic $77,188 |
| Pueblo | 0.0 /100 | #341 | Tragic $76,880 |