Filipino vs Immigrants from Western Africa Per Capita Income
COMPARE
Filipino
Immigrants from Western Africa
Per Capita Income
Per Capita Income Comparison
Filipinos
Immigrants from Western Africa
$59,066
PER CAPITA INCOME
100.0/ 100
METRIC RATING
1st/ 347
METRIC RANK
$40,294
PER CAPITA INCOME
2.2/ 100
METRIC RATING
242nd/ 347
METRIC RANK
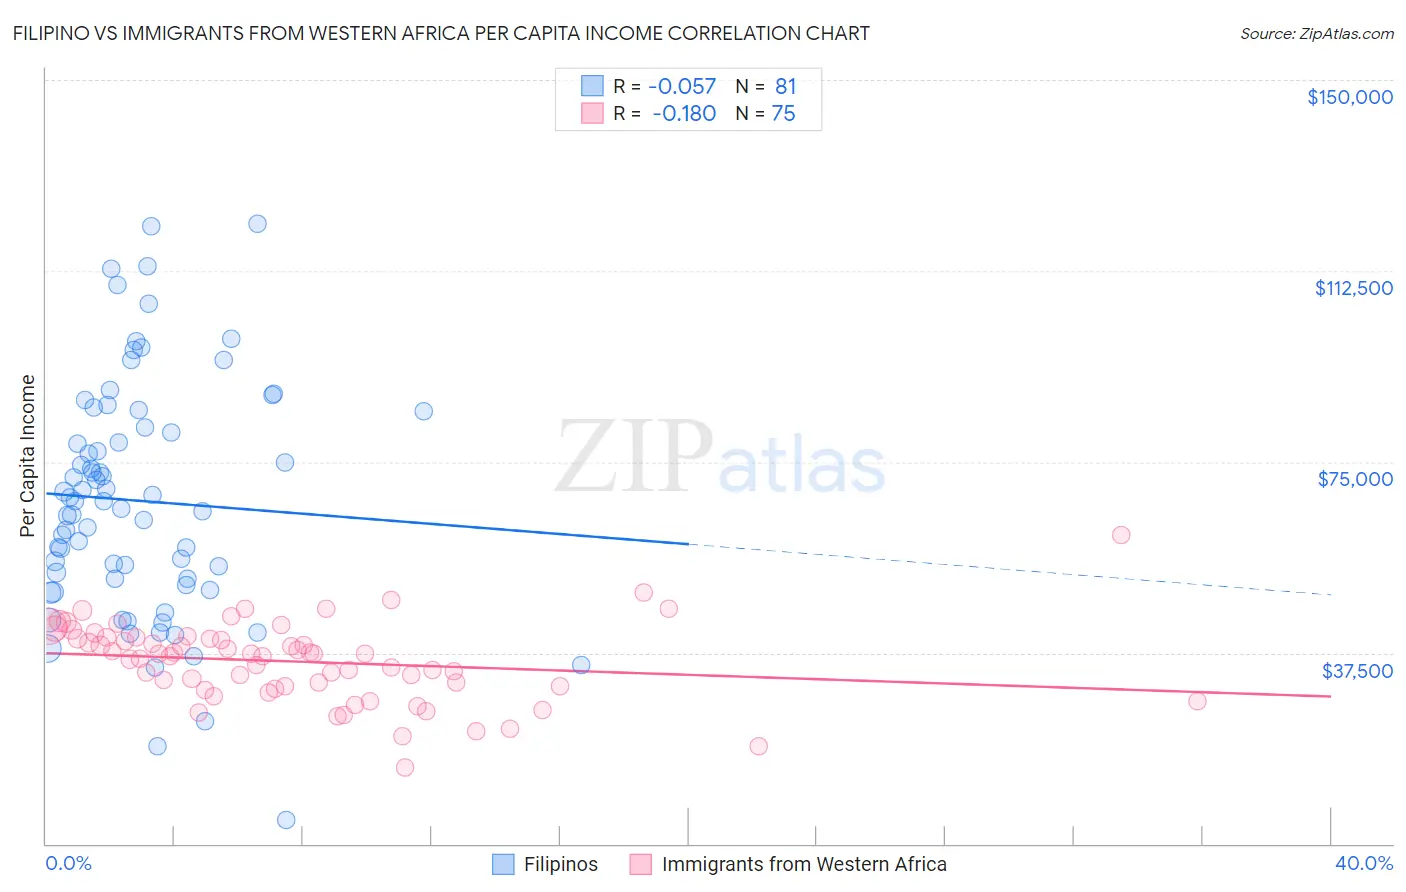
Filipino vs Immigrants from Western Africa Per Capita Income Correlation Chart
The statistical analysis conducted on geographies consisting of 254,359,894 people shows a slight negative correlation between the proportion of Filipinos and per capita income in the United States with a correlation coefficient (R) of -0.057 and weighted average of $59,066. Similarly, the statistical analysis conducted on geographies consisting of 357,903,871 people shows a poor negative correlation between the proportion of Immigrants from Western Africa and per capita income in the United States with a correlation coefficient (R) of -0.180 and weighted average of $40,294, a difference of 46.6%.
Per Capita Income Correlation Summary
| Measurement | Filipino | Immigrants from Western Africa |
| Minimum | $4,657 | $15,041 |
| Maximum | $121,798 | $60,586 |
| Range | $117,141 | $45,545 |
| Mean | $67,314 | $35,763 |
| Median | $67,249 | $37,211 |
| Interquartile 25% (IQ1) | $51,364 | $30,829 |
| Interquartile 75% (IQ3) | $83,421 | $40,508 |
| Interquartile Range (IQR) | $32,057 | $9,679 |
| Standard Deviation (Sample) | $23,294 | $7,739 |
| Standard Deviation (Population) | $23,149 | $7,688 |
Similar Demographics by Per Capita Income
Demographics Similar to Filipinos by Per Capita Income
In terms of per capita income, the demographic groups most similar to Filipinos are Iranian ($58,786, a difference of 0.48%), Immigrants from Singapore ($58,353, a difference of 1.2%), Immigrants from Australia ($57,953, a difference of 1.9%), Immigrants from Iran ($57,759, a difference of 2.3%), and Immigrants from Taiwan ($57,742, a difference of 2.3%).
| Demographics | Rating | Rank | Per Capita Income |
| Filipinos | 100.0 /100 | #1 | Exceptional $59,066 |
| Iranians | 100.0 /100 | #2 | Exceptional $58,786 |
| Immigrants | Singapore | 100.0 /100 | #3 | Exceptional $58,353 |
| Immigrants | Australia | 100.0 /100 | #4 | Exceptional $57,953 |
| Immigrants | Iran | 100.0 /100 | #5 | Exceptional $57,759 |
| Immigrants | Taiwan | 100.0 /100 | #6 | Exceptional $57,742 |
| Immigrants | Israel | 100.0 /100 | #7 | Exceptional $57,384 |
| Immigrants | Hong Kong | 100.0 /100 | #8 | Exceptional $56,709 |
| Immigrants | Ireland | 100.0 /100 | #9 | Exceptional $56,584 |
| Okinawans | 100.0 /100 | #10 | Exceptional $55,817 |
| Eastern Europeans | 100.0 /100 | #11 | Exceptional $55,780 |
| Immigrants | Sweden | 100.0 /100 | #12 | Exceptional $55,582 |
| Immigrants | India | 100.0 /100 | #13 | Exceptional $55,268 |
| Immigrants | Belgium | 100.0 /100 | #14 | Exceptional $55,082 |
| Cypriots | 100.0 /100 | #15 | Exceptional $54,899 |
Demographics Similar to Immigrants from Western Africa by Per Capita Income
In terms of per capita income, the demographic groups most similar to Immigrants from Western Africa are German Russian ($40,266, a difference of 0.070%), British West Indian ($40,330, a difference of 0.090%), Immigrants from Nigeria ($40,339, a difference of 0.11%), Tsimshian ($40,344, a difference of 0.12%), and French American Indian ($40,244, a difference of 0.13%).
| Demographics | Rating | Rank | Per Capita Income |
| Immigrants | Guyana | 3.6 /100 | #235 | Tragic $40,742 |
| Immigrants | Nonimmigrants | 3.4 /100 | #236 | Tragic $40,669 |
| Immigrants | Cambodia | 2.6 /100 | #237 | Tragic $40,434 |
| Somalis | 2.4 /100 | #238 | Tragic $40,367 |
| Tsimshian | 2.4 /100 | #239 | Tragic $40,344 |
| Immigrants | Nigeria | 2.3 /100 | #240 | Tragic $40,339 |
| British West Indians | 2.3 /100 | #241 | Tragic $40,330 |
| Immigrants | Western Africa | 2.2 /100 | #242 | Tragic $40,294 |
| German Russians | 2.2 /100 | #243 | Tragic $40,266 |
| French American Indians | 2.1 /100 | #244 | Tragic $40,244 |
| Sub-Saharan Africans | 1.9 /100 | #245 | Tragic $40,152 |
| Cree | 1.7 /100 | #246 | Tragic $40,056 |
| Immigrants | Somalia | 1.6 /100 | #247 | Tragic $39,974 |
| Cape Verdeans | 1.5 /100 | #248 | Tragic $39,935 |
| Japanese | 1.4 /100 | #249 | Tragic $39,870 |