British vs Immigrants from Western Africa Per Capita Income
COMPARE
British
Immigrants from Western Africa
Per Capita Income
Per Capita Income Comparison
British
Immigrants from Western Africa
$46,571
PER CAPITA INCOME
96.3/ 100
METRIC RATING
105th/ 347
METRIC RANK
$40,294
PER CAPITA INCOME
2.2/ 100
METRIC RATING
242nd/ 347
METRIC RANK
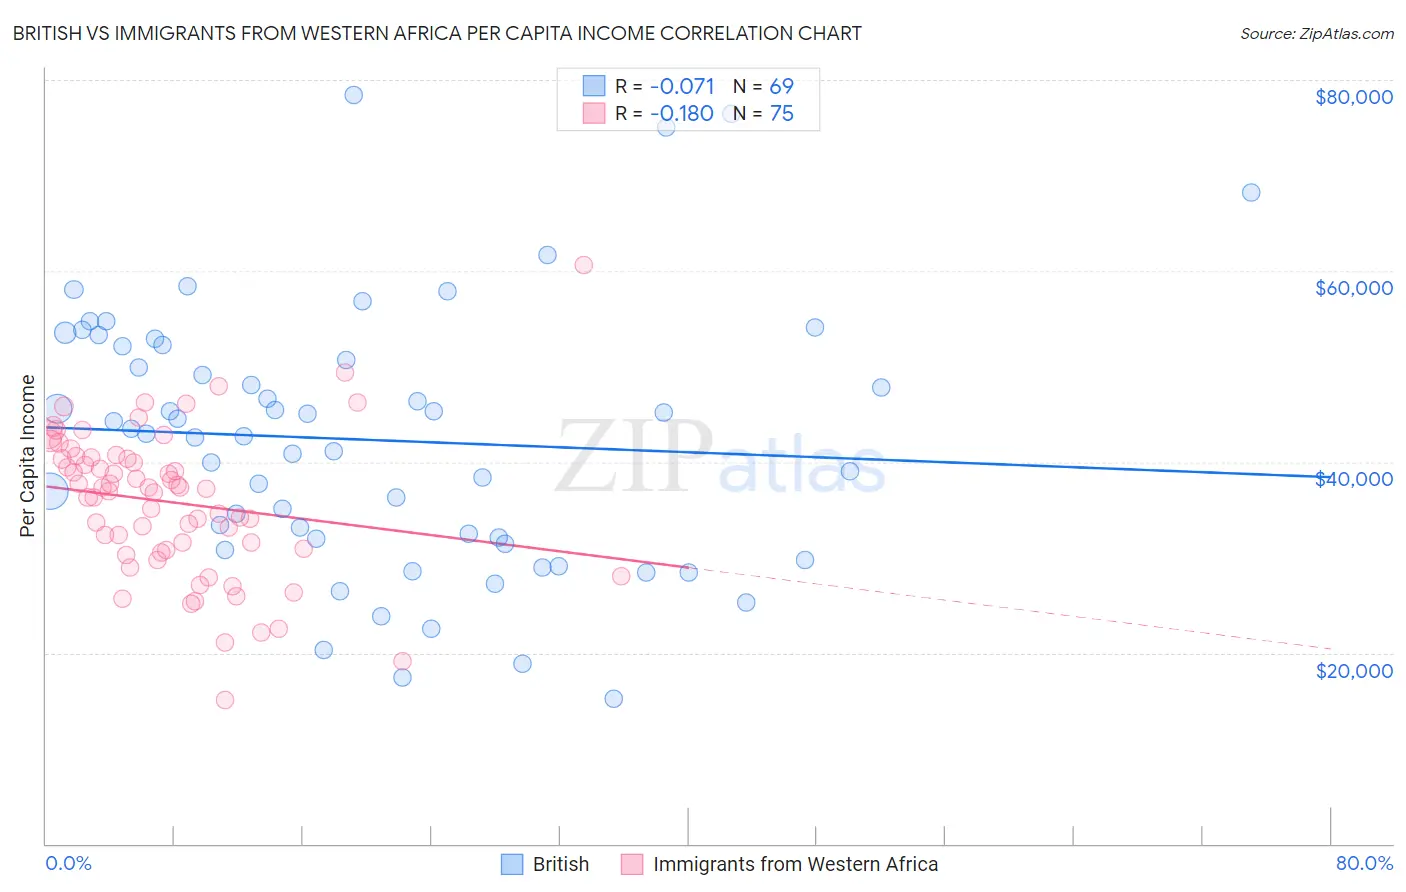
British vs Immigrants from Western Africa Per Capita Income Correlation Chart
The statistical analysis conducted on geographies consisting of 531,509,252 people shows a slight negative correlation between the proportion of British and per capita income in the United States with a correlation coefficient (R) of -0.071 and weighted average of $46,571. Similarly, the statistical analysis conducted on geographies consisting of 357,903,871 people shows a poor negative correlation between the proportion of Immigrants from Western Africa and per capita income in the United States with a correlation coefficient (R) of -0.180 and weighted average of $40,294, a difference of 15.6%.
Per Capita Income Correlation Summary
| Measurement | British | Immigrants from Western Africa |
| Minimum | $15,188 | $15,041 |
| Maximum | $78,420 | $60,586 |
| Range | $63,232 | $45,545 |
| Mean | $42,295 | $35,763 |
| Median | $42,961 | $37,211 |
| Interquartile 25% (IQ1) | $31,698 | $30,829 |
| Interquartile 75% (IQ3) | $52,162 | $40,508 |
| Interquartile Range (IQR) | $20,464 | $9,679 |
| Standard Deviation (Sample) | $13,799 | $7,739 |
| Standard Deviation (Population) | $13,699 | $7,688 |
Similar Demographics by Per Capita Income
Demographics Similar to British by Per Capita Income
In terms of per capita income, the demographic groups most similar to British are Ethiopian ($46,569, a difference of 0.0%), Serbian ($46,551, a difference of 0.040%), Immigrants from Kuwait ($46,543, a difference of 0.060%), Immigrants from Northern Africa ($46,531, a difference of 0.090%), and Chilean ($46,459, a difference of 0.24%).
| Demographics | Rating | Rank | Per Capita Income |
| Immigrants | Pakistan | 97.9 /100 | #98 | Exceptional $47,084 |
| Laotians | 97.8 /100 | #99 | Exceptional $47,041 |
| Immigrants | Lebanon | 97.5 /100 | #100 | Exceptional $46,938 |
| Immigrants | Uzbekistan | 97.5 /100 | #101 | Exceptional $46,929 |
| Immigrants | Western Asia | 97.4 /100 | #102 | Exceptional $46,876 |
| Syrians | 97.2 /100 | #103 | Exceptional $46,837 |
| Brazilians | 96.8 /100 | #104 | Exceptional $46,700 |
| British | 96.3 /100 | #105 | Exceptional $46,571 |
| Ethiopians | 96.3 /100 | #106 | Exceptional $46,569 |
| Serbians | 96.2 /100 | #107 | Exceptional $46,551 |
| Immigrants | Kuwait | 96.2 /100 | #108 | Exceptional $46,543 |
| Immigrants | Northern Africa | 96.2 /100 | #109 | Exceptional $46,531 |
| Chileans | 95.9 /100 | #110 | Exceptional $46,459 |
| Taiwanese | 95.8 /100 | #111 | Exceptional $46,455 |
| Immigrants | Morocco | 95.7 /100 | #112 | Exceptional $46,430 |
Demographics Similar to Immigrants from Western Africa by Per Capita Income
In terms of per capita income, the demographic groups most similar to Immigrants from Western Africa are German Russian ($40,266, a difference of 0.070%), British West Indian ($40,330, a difference of 0.090%), Immigrants from Nigeria ($40,339, a difference of 0.11%), Tsimshian ($40,344, a difference of 0.12%), and French American Indian ($40,244, a difference of 0.13%).
| Demographics | Rating | Rank | Per Capita Income |
| Immigrants | Guyana | 3.6 /100 | #235 | Tragic $40,742 |
| Immigrants | Nonimmigrants | 3.4 /100 | #236 | Tragic $40,669 |
| Immigrants | Cambodia | 2.6 /100 | #237 | Tragic $40,434 |
| Somalis | 2.4 /100 | #238 | Tragic $40,367 |
| Tsimshian | 2.4 /100 | #239 | Tragic $40,344 |
| Immigrants | Nigeria | 2.3 /100 | #240 | Tragic $40,339 |
| British West Indians | 2.3 /100 | #241 | Tragic $40,330 |
| Immigrants | Western Africa | 2.2 /100 | #242 | Tragic $40,294 |
| German Russians | 2.2 /100 | #243 | Tragic $40,266 |
| French American Indians | 2.1 /100 | #244 | Tragic $40,244 |
| Sub-Saharan Africans | 1.9 /100 | #245 | Tragic $40,152 |
| Cree | 1.7 /100 | #246 | Tragic $40,056 |
| Immigrants | Somalia | 1.6 /100 | #247 | Tragic $39,974 |
| Cape Verdeans | 1.5 /100 | #248 | Tragic $39,935 |
| Japanese | 1.4 /100 | #249 | Tragic $39,870 |