Cypriot vs Immigrants from Western Africa Per Capita Income
COMPARE
Cypriot
Immigrants from Western Africa
Per Capita Income
Per Capita Income Comparison
Cypriots
Immigrants from Western Africa
$54,899
PER CAPITA INCOME
100.0/ 100
METRIC RATING
15th/ 347
METRIC RANK
$40,294
PER CAPITA INCOME
2.2/ 100
METRIC RATING
242nd/ 347
METRIC RANK
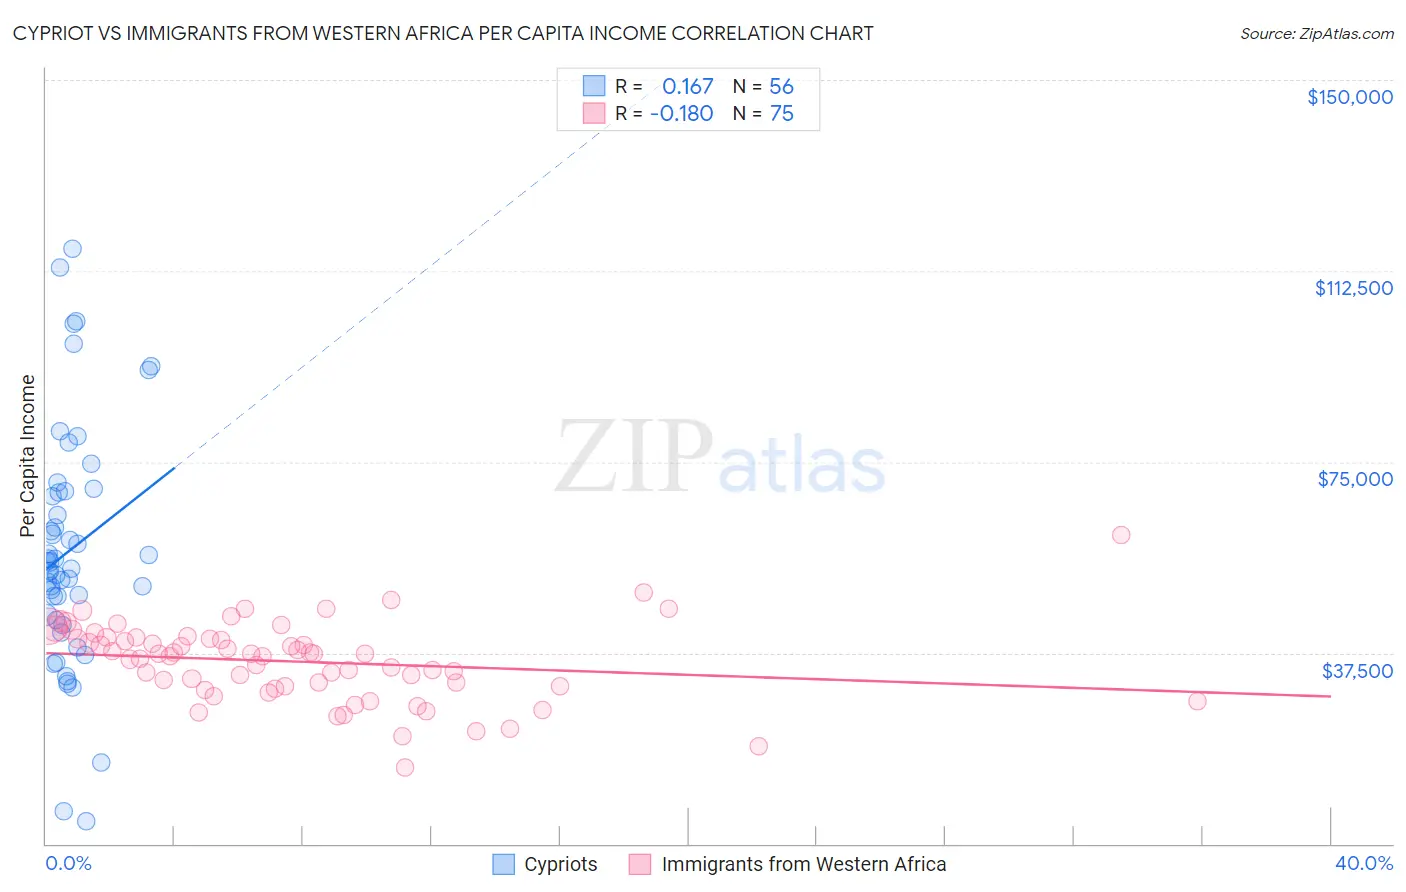
Cypriot vs Immigrants from Western Africa Per Capita Income Correlation Chart
The statistical analysis conducted on geographies consisting of 61,866,365 people shows a poor positive correlation between the proportion of Cypriots and per capita income in the United States with a correlation coefficient (R) of 0.167 and weighted average of $54,899. Similarly, the statistical analysis conducted on geographies consisting of 357,903,871 people shows a poor negative correlation between the proportion of Immigrants from Western Africa and per capita income in the United States with a correlation coefficient (R) of -0.180 and weighted average of $40,294, a difference of 36.2%.
Per Capita Income Correlation Summary
| Measurement | Cypriot | Immigrants from Western Africa |
| Minimum | $4,509 | $15,041 |
| Maximum | $116,766 | $60,586 |
| Range | $112,257 | $45,545 |
| Mean | $57,593 | $35,763 |
| Median | $54,638 | $37,211 |
| Interquartile 25% (IQ1) | $44,518 | $30,829 |
| Interquartile 75% (IQ3) | $69,117 | $40,508 |
| Interquartile Range (IQR) | $24,599 | $9,679 |
| Standard Deviation (Sample) | $23,513 | $7,739 |
| Standard Deviation (Population) | $23,302 | $7,688 |
Similar Demographics by Per Capita Income
Demographics Similar to Cypriots by Per Capita Income
In terms of per capita income, the demographic groups most similar to Cypriots are Immigrants from Switzerland ($54,866, a difference of 0.060%), Immigrants from Belgium ($55,082, a difference of 0.33%), Immigrants from France ($54,557, a difference of 0.63%), Immigrants from India ($55,268, a difference of 0.67%), and Thai ($54,307, a difference of 1.1%).
| Demographics | Rating | Rank | Per Capita Income |
| Immigrants | Hong Kong | 100.0 /100 | #8 | Exceptional $56,709 |
| Immigrants | Ireland | 100.0 /100 | #9 | Exceptional $56,584 |
| Okinawans | 100.0 /100 | #10 | Exceptional $55,817 |
| Eastern Europeans | 100.0 /100 | #11 | Exceptional $55,780 |
| Immigrants | Sweden | 100.0 /100 | #12 | Exceptional $55,582 |
| Immigrants | India | 100.0 /100 | #13 | Exceptional $55,268 |
| Immigrants | Belgium | 100.0 /100 | #14 | Exceptional $55,082 |
| Cypriots | 100.0 /100 | #15 | Exceptional $54,899 |
| Immigrants | Switzerland | 100.0 /100 | #16 | Exceptional $54,866 |
| Immigrants | France | 100.0 /100 | #17 | Exceptional $54,557 |
| Thais | 100.0 /100 | #18 | Exceptional $54,307 |
| Immigrants | China | 100.0 /100 | #19 | Exceptional $54,264 |
| Soviet Union | 100.0 /100 | #20 | Exceptional $54,202 |
| Immigrants | Northern Europe | 100.0 /100 | #21 | Exceptional $54,159 |
| Indians (Asian) | 100.0 /100 | #22 | Exceptional $53,874 |
Demographics Similar to Immigrants from Western Africa by Per Capita Income
In terms of per capita income, the demographic groups most similar to Immigrants from Western Africa are German Russian ($40,266, a difference of 0.070%), British West Indian ($40,330, a difference of 0.090%), Immigrants from Nigeria ($40,339, a difference of 0.11%), Tsimshian ($40,344, a difference of 0.12%), and French American Indian ($40,244, a difference of 0.13%).
| Demographics | Rating | Rank | Per Capita Income |
| Immigrants | Guyana | 3.6 /100 | #235 | Tragic $40,742 |
| Immigrants | Nonimmigrants | 3.4 /100 | #236 | Tragic $40,669 |
| Immigrants | Cambodia | 2.6 /100 | #237 | Tragic $40,434 |
| Somalis | 2.4 /100 | #238 | Tragic $40,367 |
| Tsimshian | 2.4 /100 | #239 | Tragic $40,344 |
| Immigrants | Nigeria | 2.3 /100 | #240 | Tragic $40,339 |
| British West Indians | 2.3 /100 | #241 | Tragic $40,330 |
| Immigrants | Western Africa | 2.2 /100 | #242 | Tragic $40,294 |
| German Russians | 2.2 /100 | #243 | Tragic $40,266 |
| French American Indians | 2.1 /100 | #244 | Tragic $40,244 |
| Sub-Saharan Africans | 1.9 /100 | #245 | Tragic $40,152 |
| Cree | 1.7 /100 | #246 | Tragic $40,056 |
| Immigrants | Somalia | 1.6 /100 | #247 | Tragic $39,974 |
| Cape Verdeans | 1.5 /100 | #248 | Tragic $39,935 |
| Japanese | 1.4 /100 | #249 | Tragic $39,870 |