Immigrants from Bolivia vs Australian Median Family Income
COMPARE
Immigrants from Bolivia
Australian
Median Family Income
Median Family Income Comparison
Immigrants from Bolivia
Australians
$117,912
MEDIAN FAMILY INCOME
100.0/ 100
METRIC RATING
42nd/ 347
METRIC RANK
$118,440
MEDIAN FAMILY INCOME
100.0/ 100
METRIC RATING
37th/ 347
METRIC RANK
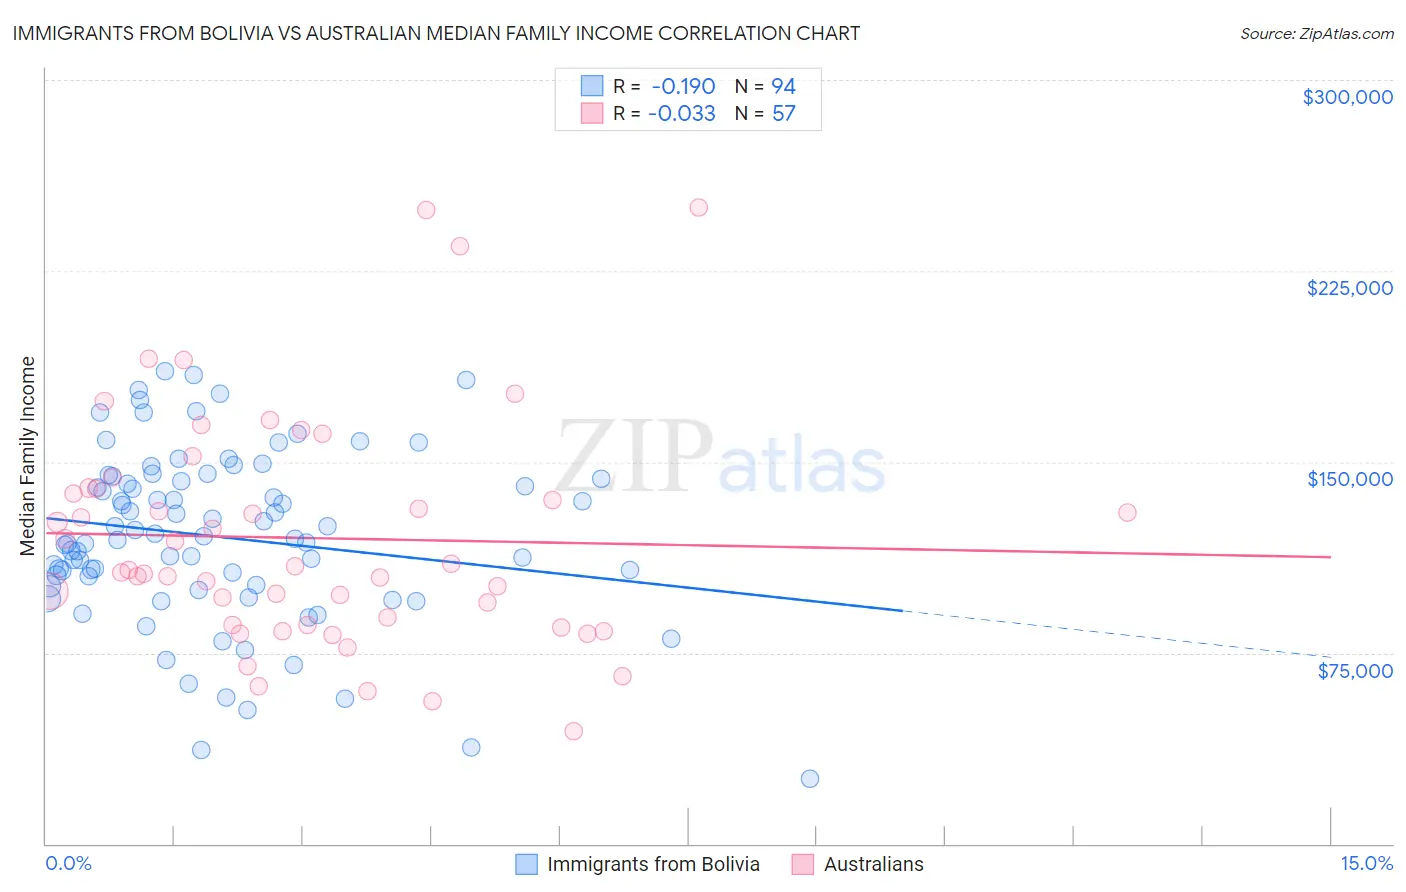
Immigrants from Bolivia vs Australian Median Family Income Correlation Chart
The statistical analysis conducted on geographies consisting of 158,713,434 people shows a poor negative correlation between the proportion of Immigrants from Bolivia and median family income in the United States with a correlation coefficient (R) of -0.190 and weighted average of $117,912. Similarly, the statistical analysis conducted on geographies consisting of 223,969,343 people shows no correlation between the proportion of Australians and median family income in the United States with a correlation coefficient (R) of -0.033 and weighted average of $118,440, a difference of 0.45%.
Median Family Income Correlation Summary
| Measurement | Immigrants from Bolivia | Australian |
| Minimum | $25,703 | $44,219 |
| Maximum | $185,567 | $250,001 |
| Range | $159,864 | $205,782 |
| Mean | $120,434 | $120,063 |
| Median | $120,122 | $107,342 |
| Interquartile 25% (IQ1) | $101,733 | $85,865 |
| Interquartile 75% (IQ3) | $143,542 | $139,651 |
| Interquartile Range (IQR) | $41,809 | $53,786 |
| Standard Deviation (Sample) | $33,861 | $45,096 |
| Standard Deviation (Population) | $33,681 | $44,699 |
Demographics Similar to Immigrants from Bolivia and Australians by Median Family Income
In terms of median family income, the demographic groups most similar to Immigrants from Bolivia are Bulgarian ($117,818, a difference of 0.080%), Estonian ($118,013, a difference of 0.090%), Cambodian ($117,780, a difference of 0.11%), Immigrants from Lithuania ($118,053, a difference of 0.12%), and Immigrants from Asia ($118,291, a difference of 0.32%). Similarly, the demographic groups most similar to Australians are Immigrants from Turkey ($118,325, a difference of 0.10%), Israeli ($118,577, a difference of 0.12%), Immigrants from Asia ($118,291, a difference of 0.13%), Immigrants from Lithuania ($118,053, a difference of 0.33%), and Estonian ($118,013, a difference of 0.36%).
| Demographics | Rating | Rank | Median Family Income |
| Latvians | 100.0 /100 | #29 | Exceptional $120,301 |
| Immigrants | Sri Lanka | 100.0 /100 | #30 | Exceptional $120,263 |
| Immigrants | France | 100.0 /100 | #31 | Exceptional $120,076 |
| Asians | 100.0 /100 | #32 | Exceptional $119,955 |
| Bhutanese | 100.0 /100 | #33 | Exceptional $119,800 |
| Bolivians | 100.0 /100 | #34 | Exceptional $119,479 |
| Soviet Union | 100.0 /100 | #35 | Exceptional $119,262 |
| Israelis | 100.0 /100 | #36 | Exceptional $118,577 |
| Australians | 100.0 /100 | #37 | Exceptional $118,440 |
| Immigrants | Turkey | 100.0 /100 | #38 | Exceptional $118,325 |
| Immigrants | Asia | 100.0 /100 | #39 | Exceptional $118,291 |
| Immigrants | Lithuania | 100.0 /100 | #40 | Exceptional $118,053 |
| Estonians | 100.0 /100 | #41 | Exceptional $118,013 |
| Immigrants | Bolivia | 100.0 /100 | #42 | Exceptional $117,912 |
| Bulgarians | 100.0 /100 | #43 | Exceptional $117,818 |
| Cambodians | 100.0 /100 | #44 | Exceptional $117,780 |
| Immigrants | Greece | 99.9 /100 | #45 | Exceptional $117,344 |
| Immigrants | Russia | 99.9 /100 | #46 | Exceptional $116,942 |
| Immigrants | Austria | 99.9 /100 | #47 | Exceptional $116,830 |
| Immigrants | South Africa | 99.9 /100 | #48 | Exceptional $116,286 |
| Chinese | 99.9 /100 | #49 | Exceptional $116,188 |