Immigrants from Brazil vs Australian Median Family Income
COMPARE
Immigrants from Brazil
Australian
Median Family Income
Median Family Income Comparison
Immigrants from Brazil
Australians
$109,418
MEDIAN FAMILY INCOME
96.9/ 100
METRIC RATING
103rd/ 347
METRIC RANK
$118,440
MEDIAN FAMILY INCOME
100.0/ 100
METRIC RATING
37th/ 347
METRIC RANK
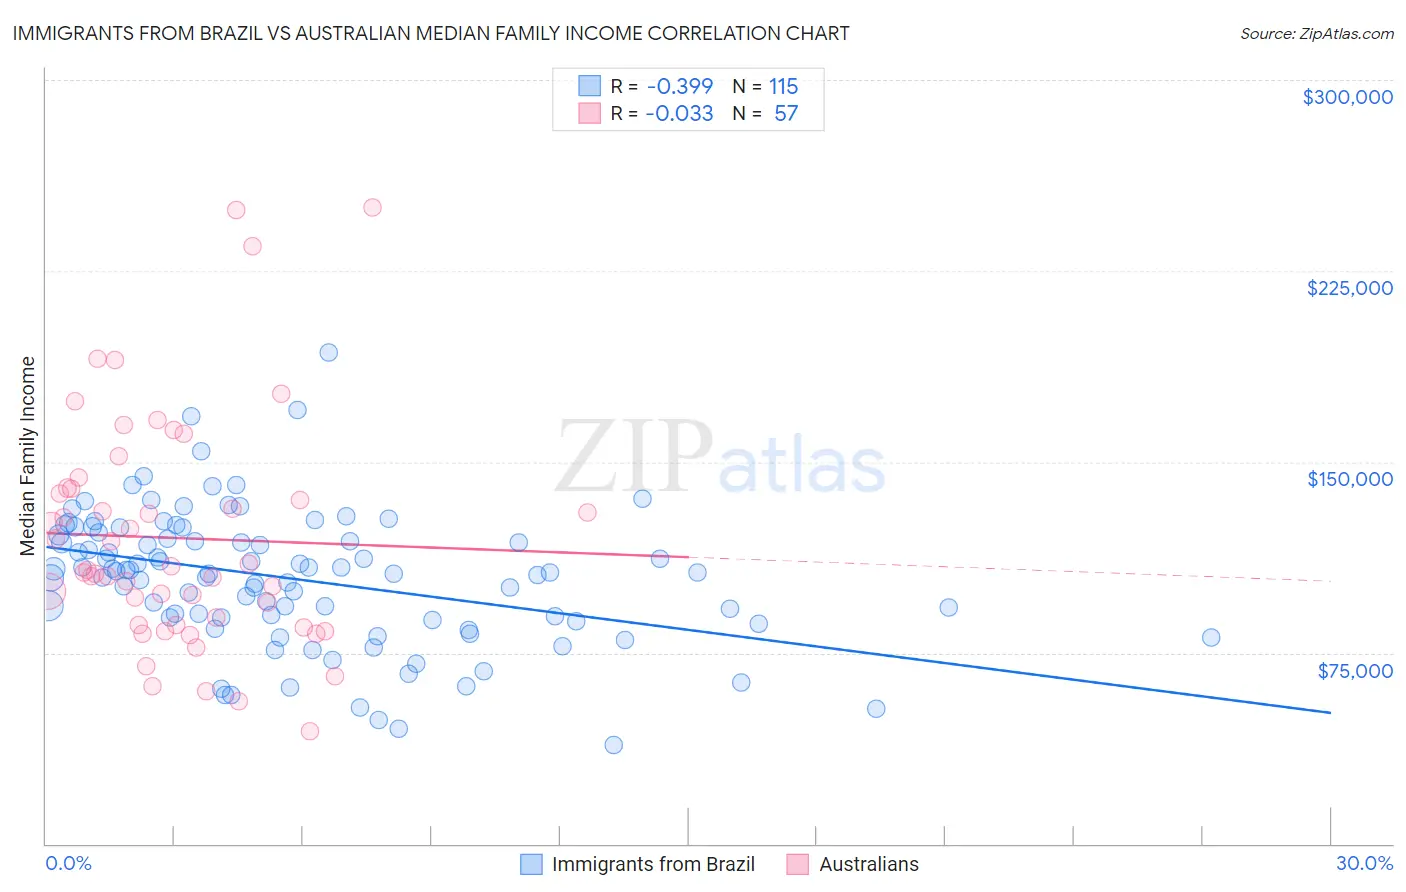
Immigrants from Brazil vs Australian Median Family Income Correlation Chart
The statistical analysis conducted on geographies consisting of 342,786,060 people shows a mild negative correlation between the proportion of Immigrants from Brazil and median family income in the United States with a correlation coefficient (R) of -0.399 and weighted average of $109,418. Similarly, the statistical analysis conducted on geographies consisting of 223,969,343 people shows no correlation between the proportion of Australians and median family income in the United States with a correlation coefficient (R) of -0.033 and weighted average of $118,440, a difference of 8.3%.
Median Family Income Correlation Summary
| Measurement | Immigrants from Brazil | Australian |
| Minimum | $38,641 | $44,219 |
| Maximum | $192,802 | $250,001 |
| Range | $154,161 | $205,782 |
| Mean | $103,935 | $120,063 |
| Median | $106,400 | $107,342 |
| Interquartile 25% (IQ1) | $87,917 | $85,865 |
| Interquartile 75% (IQ3) | $121,341 | $139,651 |
| Interquartile Range (IQR) | $33,424 | $53,786 |
| Standard Deviation (Sample) | $26,654 | $45,096 |
| Standard Deviation (Population) | $26,538 | $44,699 |
Similar Demographics by Median Family Income
Demographics Similar to Immigrants from Brazil by Median Family Income
In terms of median family income, the demographic groups most similar to Immigrants from Brazil are Palestinian ($109,413, a difference of 0.0%), Syrian ($109,299, a difference of 0.11%), Assyrian/Chaldean/Syriac ($109,622, a difference of 0.19%), Immigrants from Ukraine ($109,645, a difference of 0.21%), and Macedonian ($109,668, a difference of 0.23%).
| Demographics | Rating | Rank | Median Family Income |
| Immigrants | Moldova | 97.7 /100 | #96 | Exceptional $109,975 |
| Jordanians | 97.5 /100 | #97 | Exceptional $109,865 |
| Immigrants | Kuwait | 97.4 /100 | #98 | Exceptional $109,731 |
| Armenians | 97.3 /100 | #99 | Exceptional $109,692 |
| Macedonians | 97.3 /100 | #100 | Exceptional $109,668 |
| Immigrants | Ukraine | 97.2 /100 | #101 | Exceptional $109,645 |
| Assyrians/Chaldeans/Syriacs | 97.2 /100 | #102 | Exceptional $109,622 |
| Immigrants | Brazil | 96.9 /100 | #103 | Exceptional $109,418 |
| Palestinians | 96.9 /100 | #104 | Exceptional $109,413 |
| Syrians | 96.7 /100 | #105 | Exceptional $109,299 |
| Albanians | 96.4 /100 | #106 | Exceptional $109,136 |
| Immigrants | North Macedonia | 96.4 /100 | #107 | Exceptional $109,136 |
| Immigrants | Zimbabwe | 95.9 /100 | #108 | Exceptional $108,830 |
| Immigrants | Afghanistan | 95.6 /100 | #109 | Exceptional $108,709 |
| British | 95.6 /100 | #110 | Exceptional $108,705 |
Demographics Similar to Australians by Median Family Income
In terms of median family income, the demographic groups most similar to Australians are Immigrants from Turkey ($118,325, a difference of 0.10%), Israeli ($118,577, a difference of 0.12%), Immigrants from Asia ($118,291, a difference of 0.13%), Immigrants from Lithuania ($118,053, a difference of 0.33%), and Estonian ($118,013, a difference of 0.36%).
| Demographics | Rating | Rank | Median Family Income |
| Immigrants | Sri Lanka | 100.0 /100 | #30 | Exceptional $120,263 |
| Immigrants | France | 100.0 /100 | #31 | Exceptional $120,076 |
| Asians | 100.0 /100 | #32 | Exceptional $119,955 |
| Bhutanese | 100.0 /100 | #33 | Exceptional $119,800 |
| Bolivians | 100.0 /100 | #34 | Exceptional $119,479 |
| Soviet Union | 100.0 /100 | #35 | Exceptional $119,262 |
| Israelis | 100.0 /100 | #36 | Exceptional $118,577 |
| Australians | 100.0 /100 | #37 | Exceptional $118,440 |
| Immigrants | Turkey | 100.0 /100 | #38 | Exceptional $118,325 |
| Immigrants | Asia | 100.0 /100 | #39 | Exceptional $118,291 |
| Immigrants | Lithuania | 100.0 /100 | #40 | Exceptional $118,053 |
| Estonians | 100.0 /100 | #41 | Exceptional $118,013 |
| Immigrants | Bolivia | 100.0 /100 | #42 | Exceptional $117,912 |
| Bulgarians | 100.0 /100 | #43 | Exceptional $117,818 |
| Cambodians | 100.0 /100 | #44 | Exceptional $117,780 |