Osage vs Australian College, 1 year or more
COMPARE
Osage
Australian
College, 1 year or more
College, 1 year or more Comparison
Osage
Australians
55.8%
COLLEGE, 1 YEAR OR MORE
1.0/ 100
METRIC RATING
243rd/ 347
METRIC RANK
64.6%
COLLEGE, 1 YEAR OR MORE
99.9/ 100
METRIC RATING
47th/ 347
METRIC RANK
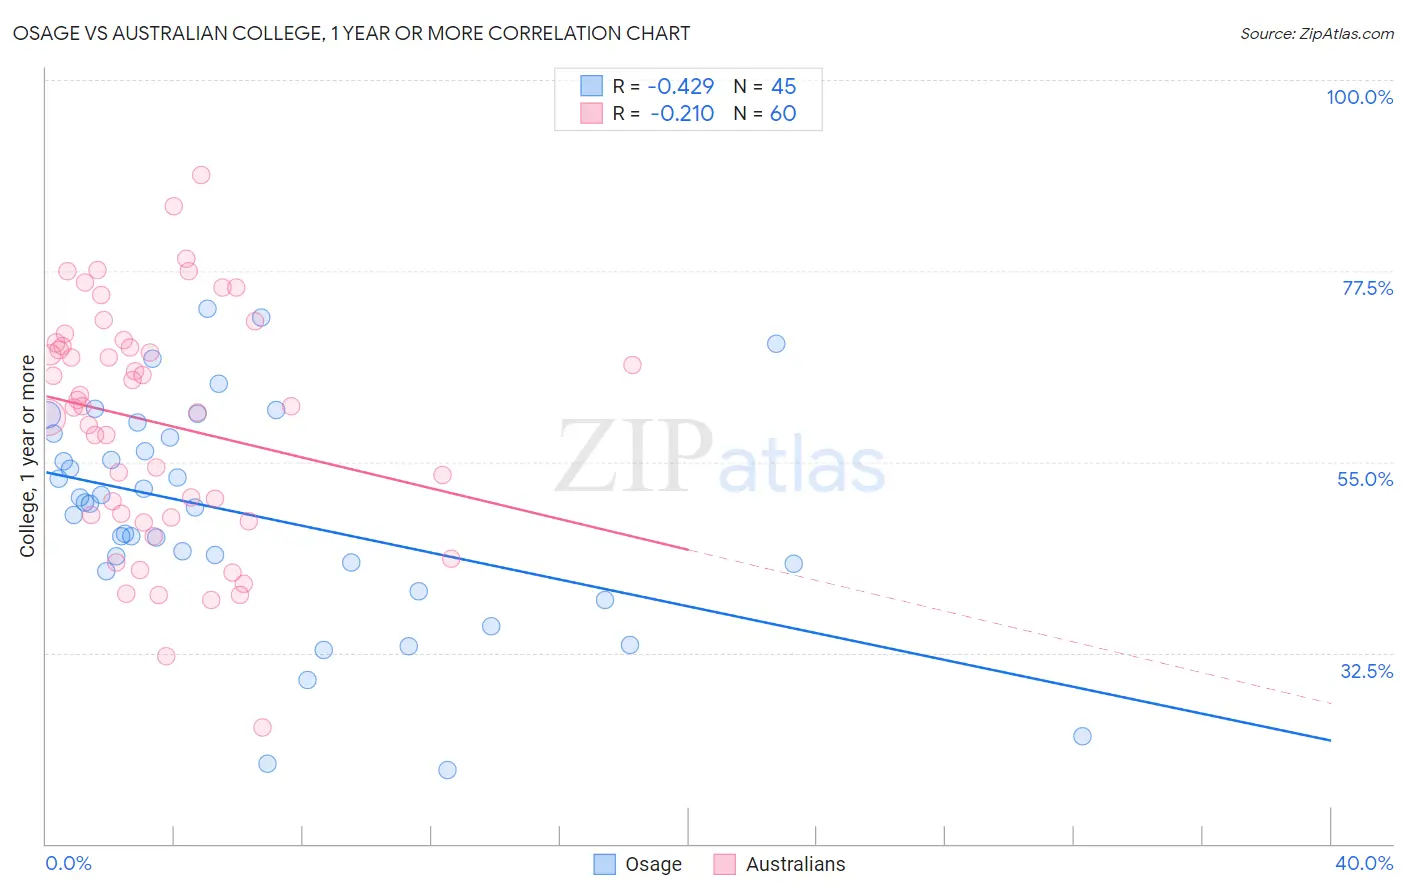
Osage vs Australian College, 1 year or more Correlation Chart
The statistical analysis conducted on geographies consisting of 91,808,929 people shows a moderate negative correlation between the proportion of Osage and percentage of population with at least college, 1 year or more education in the United States with a correlation coefficient (R) of -0.429 and weighted average of 55.8%. Similarly, the statistical analysis conducted on geographies consisting of 224,162,526 people shows a weak negative correlation between the proportion of Australians and percentage of population with at least college, 1 year or more education in the United States with a correlation coefficient (R) of -0.210 and weighted average of 64.6%, a difference of 15.9%.
College, 1 year or more Correlation Summary
| Measurement | Osage | Australian |
| Minimum | 18.8% | 23.7% |
| Maximum | 73.1% | 88.8% |
| Range | 54.3% | 65.1% |
| Mean | 48.7% | 59.6% |
| Median | 50.1% | 61.6% |
| Interquartile 25% (IQ1) | 42.6% | 48.6% |
| Interquartile 75% (IQ3) | 58.1% | 68.8% |
| Interquartile Range (IQR) | 15.5% | 20.2% |
| Standard Deviation (Sample) | 12.9% | 14.0% |
| Standard Deviation (Population) | 12.8% | 13.8% |
Similar Demographics by College, 1 year or more
Demographics Similar to Osage by College, 1 year or more
In terms of college, 1 year or more, the demographic groups most similar to Osage are Marshallese (55.8%, a difference of 0.010%), French American Indian (55.8%, a difference of 0.12%), Chippewa (55.7%, a difference of 0.12%), Trinidadian and Tobagonian (55.8%, a difference of 0.16%), and Immigrants from Liberia (55.7%, a difference of 0.19%).
| Demographics | Rating | Rank | College, 1 year or more |
| Iroquois | 1.7 /100 | #236 | Tragic 56.2% |
| Samoans | 1.6 /100 | #237 | Tragic 56.2% |
| Barbadians | 1.3 /100 | #238 | Tragic 56.0% |
| Puget Sound Salish | 1.1 /100 | #239 | Tragic 55.9% |
| Trinidadians and Tobagonians | 1.1 /100 | #240 | Tragic 55.8% |
| French American Indians | 1.0 /100 | #241 | Tragic 55.8% |
| Marshallese | 1.0 /100 | #242 | Tragic 55.8% |
| Osage | 1.0 /100 | #243 | Tragic 55.8% |
| Chippewa | 0.9 /100 | #244 | Tragic 55.7% |
| Immigrants | Liberia | 0.8 /100 | #245 | Tragic 55.7% |
| Malaysians | 0.8 /100 | #246 | Tragic 55.6% |
| Hawaiians | 0.8 /100 | #247 | Tragic 55.6% |
| Immigrants | Congo | 0.8 /100 | #248 | Tragic 55.6% |
| Immigrants | Trinidad and Tobago | 0.7 /100 | #249 | Tragic 55.5% |
| Delaware | 0.7 /100 | #250 | Tragic 55.5% |
Demographics Similar to Australians by College, 1 year or more
In terms of college, 1 year or more, the demographic groups most similar to Australians are Bhutanese (64.6%, a difference of 0.010%), Immigrants from Lithuania (64.6%, a difference of 0.020%), Immigrants from Bulgaria (64.6%, a difference of 0.030%), New Zealander (64.6%, a difference of 0.070%), and Immigrants from Norway (64.7%, a difference of 0.18%).
| Demographics | Rating | Rank | College, 1 year or more |
| Immigrants | Kuwait | 99.9 /100 | #40 | Exceptional 65.0% |
| Mongolians | 99.9 /100 | #41 | Exceptional 64.8% |
| Immigrants | Latvia | 99.9 /100 | #42 | Exceptional 64.8% |
| Immigrants | Russia | 99.9 /100 | #43 | Exceptional 64.7% |
| Immigrants | Norway | 99.9 /100 | #44 | Exceptional 64.7% |
| Immigrants | Lithuania | 99.9 /100 | #45 | Exceptional 64.6% |
| Bhutanese | 99.9 /100 | #46 | Exceptional 64.6% |
| Australians | 99.9 /100 | #47 | Exceptional 64.6% |
| Immigrants | Bulgaria | 99.9 /100 | #48 | Exceptional 64.6% |
| New Zealanders | 99.9 /100 | #49 | Exceptional 64.6% |
| Immigrants | Austria | 99.8 /100 | #50 | Exceptional 64.4% |
| Immigrants | Malaysia | 99.8 /100 | #51 | Exceptional 64.3% |
| Immigrants | Netherlands | 99.8 /100 | #52 | Exceptional 64.2% |
| Asians | 99.8 /100 | #53 | Exceptional 64.2% |
| Zimbabweans | 99.8 /100 | #54 | Exceptional 64.2% |