Danish vs Immigrants from Zimbabwe Median Household Income
COMPARE
Danish
Immigrants from Zimbabwe
Median Household Income
Median Household Income Comparison
Danes
Immigrants from Zimbabwe
$87,676
MEDIAN HOUSEHOLD INCOME
83.9/ 100
METRIC RATING
143rd/ 347
METRIC RANK
$89,496
MEDIAN HOUSEHOLD INCOME
94.4/ 100
METRIC RATING
123rd/ 347
METRIC RANK
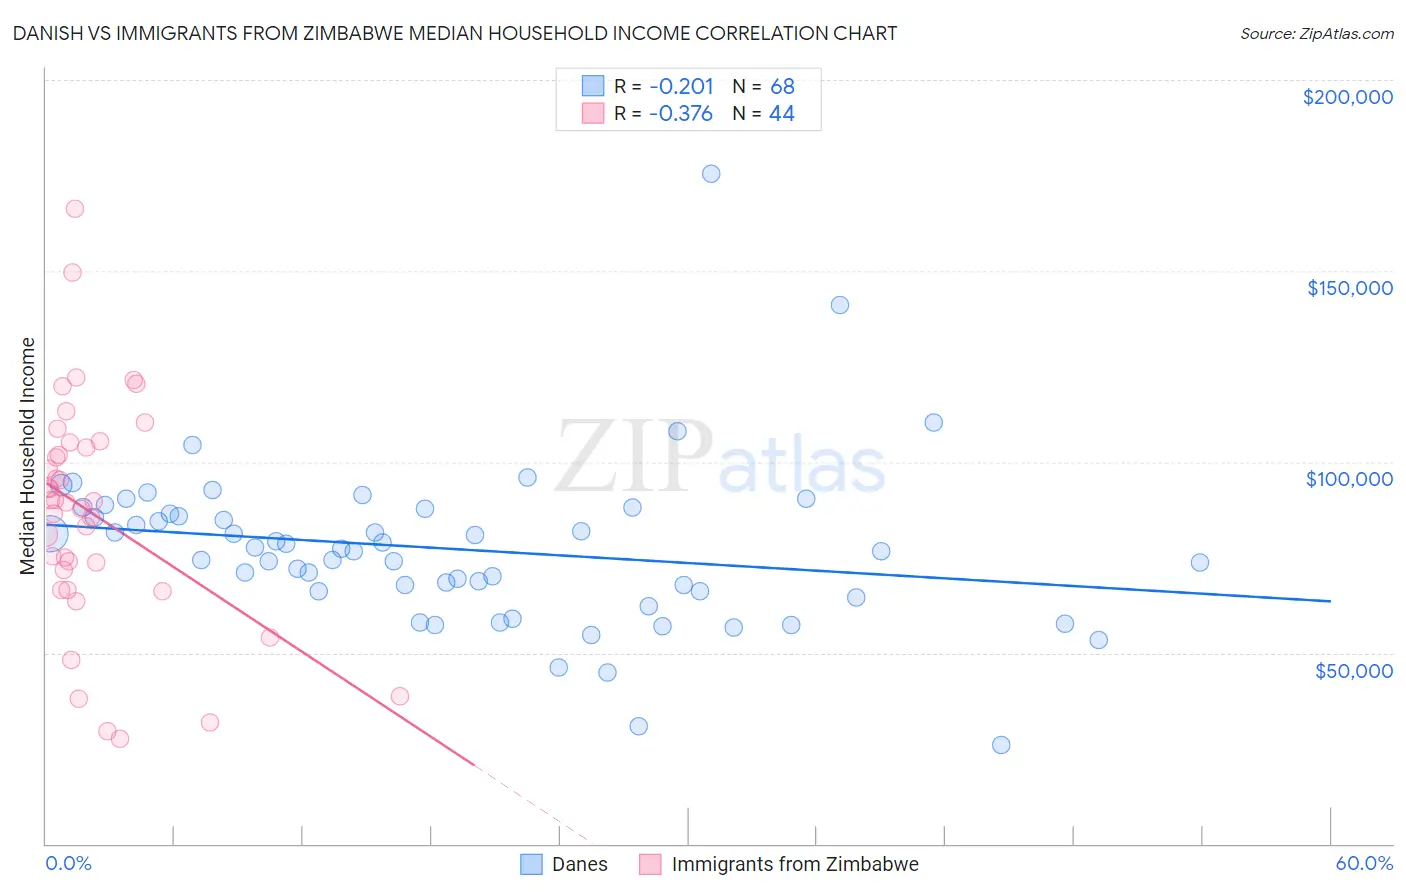
Danish vs Immigrants from Zimbabwe Median Household Income Correlation Chart
The statistical analysis conducted on geographies consisting of 473,742,440 people shows a weak negative correlation between the proportion of Danes and median household income in the United States with a correlation coefficient (R) of -0.201 and weighted average of $87,676. Similarly, the statistical analysis conducted on geographies consisting of 117,782,867 people shows a mild negative correlation between the proportion of Immigrants from Zimbabwe and median household income in the United States with a correlation coefficient (R) of -0.376 and weighted average of $89,496, a difference of 2.1%.
Median Household Income Correlation Summary
| Measurement | Danish | Immigrants from Zimbabwe |
| Minimum | $25,809 | $27,656 |
| Maximum | $175,595 | $166,303 |
| Range | $149,786 | $138,647 |
| Mean | $77,182 | $86,538 |
| Median | $76,890 | $89,467 |
| Interquartile 25% (IQ1) | $66,124 | $69,146 |
| Interquartile 75% (IQ3) | $87,030 | $104,418 |
| Interquartile Range (IQR) | $20,907 | $35,272 |
| Standard Deviation (Sample) | $21,727 | $29,812 |
| Standard Deviation (Population) | $21,566 | $29,471 |
Demographics Similar to Danes and Immigrants from Zimbabwe by Median Household Income
In terms of median household income, the demographic groups most similar to Danes are Canadian ($87,769, a difference of 0.11%), Immigrants from Morocco ($87,930, a difference of 0.29%), Lebanese ($88,091, a difference of 0.47%), Immigrants from Chile ($88,388, a difference of 0.81%), and Arab ($88,398, a difference of 0.82%). Similarly, the demographic groups most similar to Immigrants from Zimbabwe are Immigrants from Jordan ($89,412, a difference of 0.090%), Immigrants from Kuwait ($89,263, a difference of 0.26%), Immigrants from Oceania ($89,100, a difference of 0.45%), Immigrants from Peru ($89,010, a difference of 0.55%), and Portuguese ($88,976, a difference of 0.59%).
| Demographics | Rating | Rank | Median Household Income |
| Immigrants | Zimbabwe | 94.4 /100 | #123 | Exceptional $89,496 |
| Immigrants | Jordan | 94.1 /100 | #124 | Exceptional $89,412 |
| Immigrants | Kuwait | 93.5 /100 | #125 | Exceptional $89,263 |
| Immigrants | Oceania | 92.9 /100 | #126 | Exceptional $89,100 |
| Immigrants | Peru | 92.5 /100 | #127 | Exceptional $89,010 |
| Portuguese | 92.3 /100 | #128 | Exceptional $88,976 |
| Brazilians | 92.1 /100 | #129 | Exceptional $88,934 |
| British | 92.0 /100 | #130 | Exceptional $88,914 |
| Immigrants | Syria | 91.4 /100 | #131 | Exceptional $88,792 |
| Europeans | 91.2 /100 | #132 | Exceptional $88,751 |
| Immigrants | Ethiopia | 90.9 /100 | #133 | Exceptional $88,687 |
| Swedes | 90.0 /100 | #134 | Exceptional $88,524 |
| Immigrants | Sierra Leone | 89.9 /100 | #135 | Excellent $88,498 |
| Poles | 89.7 /100 | #136 | Excellent $88,472 |
| Sierra Leoneans | 89.6 /100 | #137 | Excellent $88,463 |
| Arabs | 89.2 /100 | #138 | Excellent $88,398 |
| Immigrants | Chile | 89.2 /100 | #139 | Excellent $88,388 |
| Lebanese | 87.2 /100 | #140 | Excellent $88,091 |
| Immigrants | Morocco | 86.0 /100 | #141 | Excellent $87,930 |
| Canadians | 84.7 /100 | #142 | Excellent $87,769 |
| Danes | 83.9 /100 | #143 | Excellent $87,676 |