Okinawan vs Filipino Median Household Income
COMPARE
Okinawan
Filipino
Median Household Income
Median Household Income Comparison
Okinawans
Filipinos
$106,624
MEDIAN HOUSEHOLD INCOME
100.0/ 100
METRIC RATING
9th/ 347
METRIC RANK
$115,509
MEDIAN HOUSEHOLD INCOME
100.0/ 100
METRIC RATING
2nd/ 347
METRIC RANK
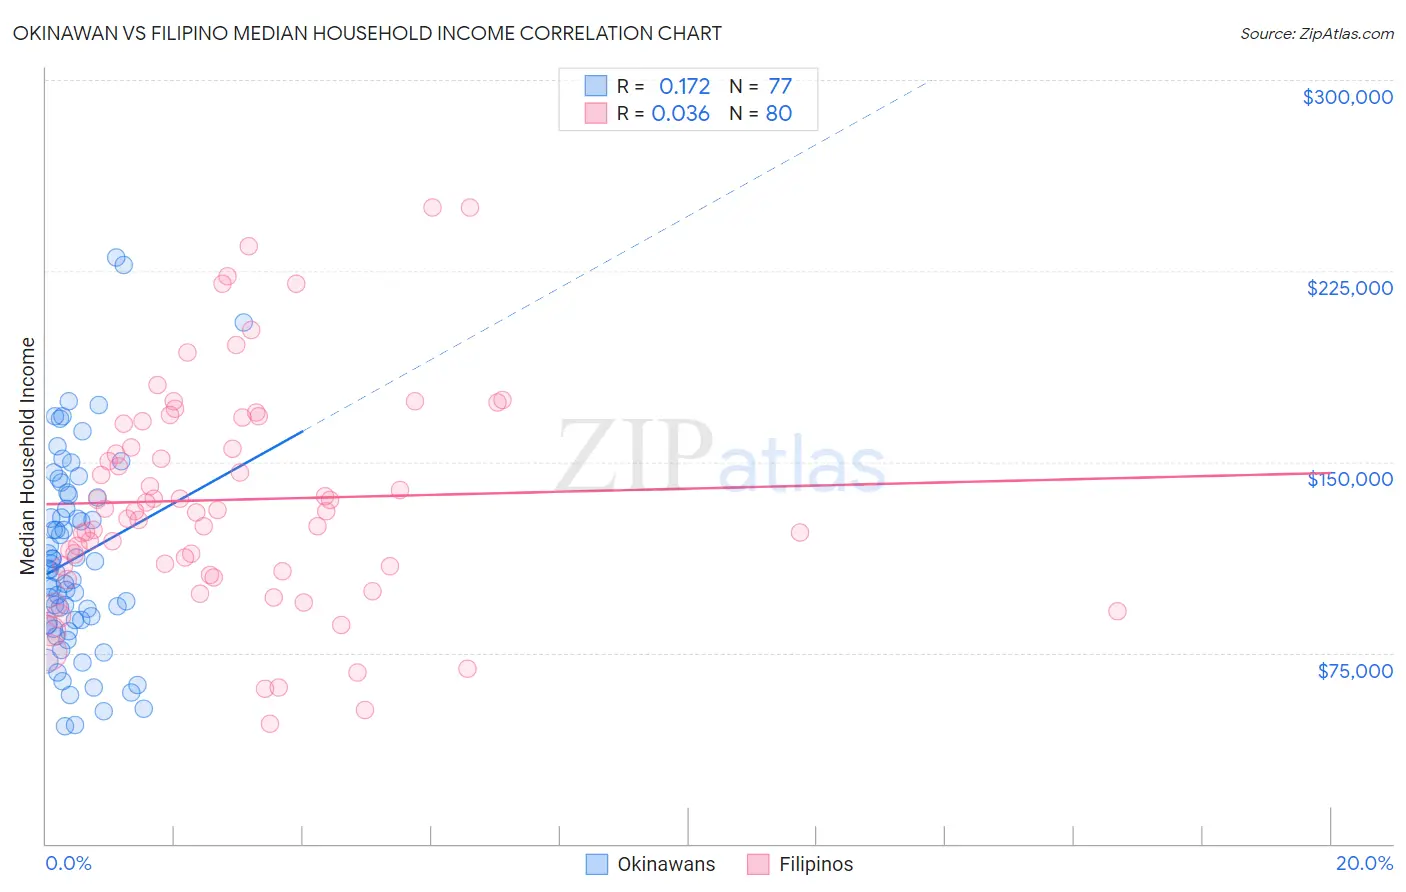
Okinawan vs Filipino Median Household Income Correlation Chart
The statistical analysis conducted on geographies consisting of 73,710,958 people shows a poor positive correlation between the proportion of Okinawans and median household income in the United States with a correlation coefficient (R) of 0.172 and weighted average of $106,624. Similarly, the statistical analysis conducted on geographies consisting of 254,115,678 people shows no correlation between the proportion of Filipinos and median household income in the United States with a correlation coefficient (R) of 0.036 and weighted average of $115,509, a difference of 8.3%.
Median Household Income Correlation Summary
| Measurement | Okinawan | Filipino |
| Minimum | $46,026 | $47,188 |
| Maximum | $230,434 | $250,001 |
| Range | $184,408 | $202,813 |
| Mean | $112,091 | $135,113 |
| Median | $107,483 | $130,633 |
| Interquartile 25% (IQ1) | $86,369 | $107,886 |
| Interquartile 75% (IQ3) | $136,400 | $165,301 |
| Interquartile Range (IQR) | $50,031 | $57,415 |
| Standard Deviation (Sample) | $39,077 | $43,772 |
| Standard Deviation (Population) | $38,823 | $43,498 |
Demographics Similar to Okinawans and Filipinos by Median Household Income
In terms of median household income, the demographic groups most similar to Okinawans are Immigrants from South Central Asia ($106,057, a difference of 0.53%), Immigrants from China ($105,335, a difference of 1.2%), Indian (Asian) ($105,262, a difference of 1.3%), Immigrants from Iran ($108,055, a difference of 1.3%), and Immigrants from Eastern Asia ($104,796, a difference of 1.7%). Similarly, the demographic groups most similar to Filipinos are Immigrants from Taiwan ($116,460, a difference of 0.82%), Immigrants from India ($113,009, a difference of 2.2%), Immigrants from Hong Kong ($111,519, a difference of 3.6%), Thai ($110,648, a difference of 4.4%), and Immigrants from Singapore ($110,428, a difference of 4.6%).
| Demographics | Rating | Rank | Median Household Income |
| Immigrants | Taiwan | 100.0 /100 | #1 | Exceptional $116,460 |
| Filipinos | 100.0 /100 | #2 | Exceptional $115,509 |
| Immigrants | India | 100.0 /100 | #3 | Exceptional $113,009 |
| Immigrants | Hong Kong | 100.0 /100 | #4 | Exceptional $111,519 |
| Thais | 100.0 /100 | #5 | Exceptional $110,648 |
| Immigrants | Singapore | 100.0 /100 | #6 | Exceptional $110,428 |
| Iranians | 100.0 /100 | #7 | Exceptional $109,835 |
| Immigrants | Iran | 100.0 /100 | #8 | Exceptional $108,055 |
| Okinawans | 100.0 /100 | #9 | Exceptional $106,624 |
| Immigrants | South Central Asia | 100.0 /100 | #10 | Exceptional $106,057 |
| Immigrants | China | 100.0 /100 | #11 | Exceptional $105,335 |
| Indians (Asian) | 100.0 /100 | #12 | Exceptional $105,262 |
| Immigrants | Eastern Asia | 100.0 /100 | #13 | Exceptional $104,796 |
| Immigrants | Ireland | 100.0 /100 | #14 | Exceptional $104,692 |
| Immigrants | Israel | 100.0 /100 | #15 | Exceptional $104,090 |
| Burmese | 100.0 /100 | #16 | Exceptional $103,145 |
| Immigrants | Korea | 100.0 /100 | #17 | Exceptional $102,962 |
| Cypriots | 100.0 /100 | #18 | Exceptional $102,843 |
| Immigrants | Australia | 100.0 /100 | #19 | Exceptional $102,562 |
| Bolivians | 100.0 /100 | #20 | Exceptional $102,195 |