Native Hawaiian vs Immigrants from Zimbabwe Median Household Income
COMPARE
Native Hawaiian
Immigrants from Zimbabwe
Median Household Income
Median Household Income Comparison
Native Hawaiians
Immigrants from Zimbabwe
$89,919
MEDIAN HOUSEHOLD INCOME
95.7/ 100
METRIC RATING
116th/ 347
METRIC RANK
$89,496
MEDIAN HOUSEHOLD INCOME
94.4/ 100
METRIC RATING
123rd/ 347
METRIC RANK
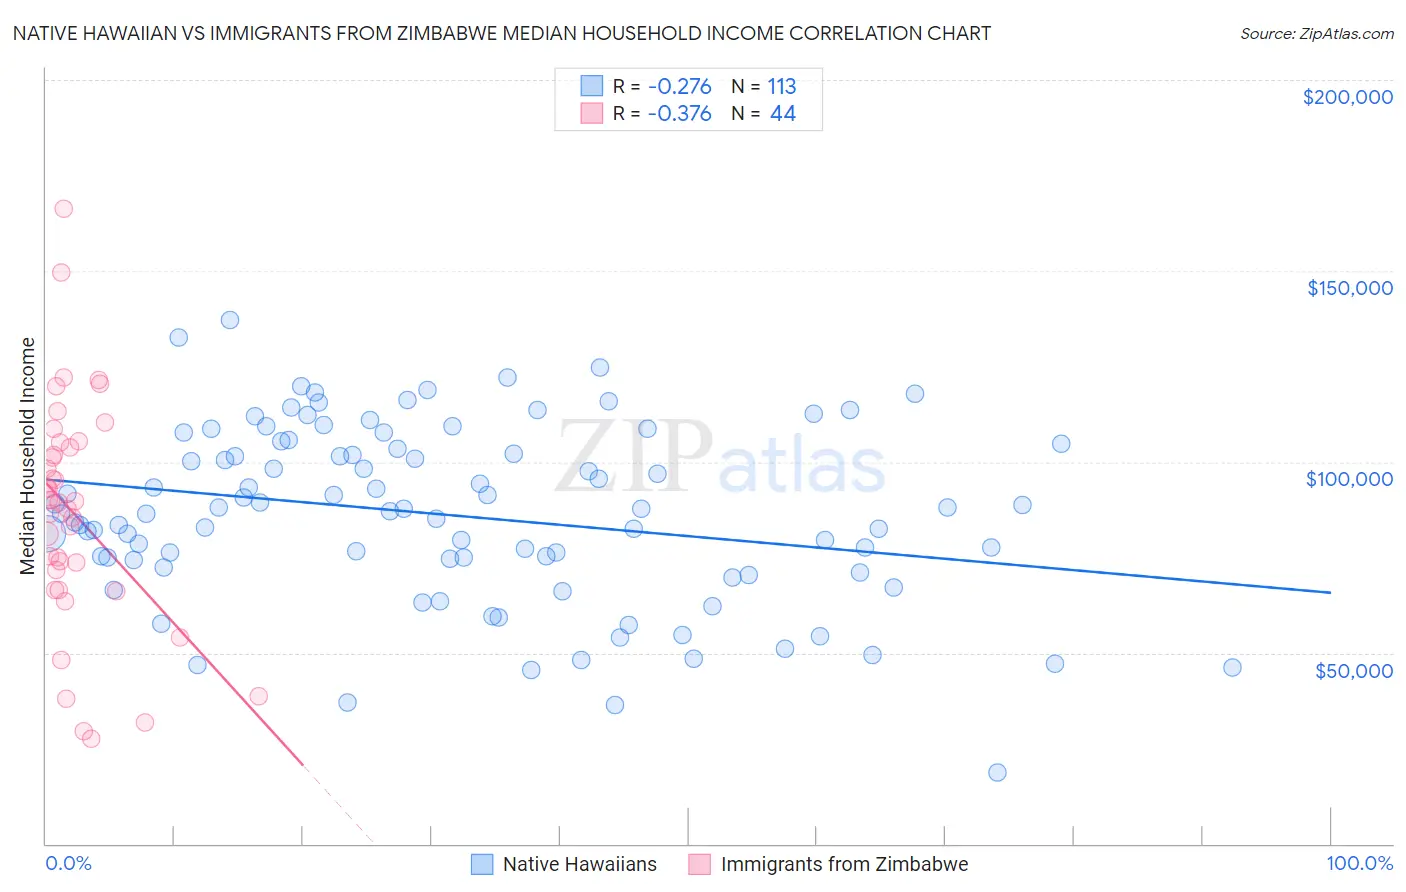
Native Hawaiian vs Immigrants from Zimbabwe Median Household Income Correlation Chart
The statistical analysis conducted on geographies consisting of 331,802,706 people shows a weak negative correlation between the proportion of Native Hawaiians and median household income in the United States with a correlation coefficient (R) of -0.276 and weighted average of $89,919. Similarly, the statistical analysis conducted on geographies consisting of 117,782,867 people shows a mild negative correlation between the proportion of Immigrants from Zimbabwe and median household income in the United States with a correlation coefficient (R) of -0.376 and weighted average of $89,496, a difference of 0.47%.
Median Household Income Correlation Summary
| Measurement | Native Hawaiian | Immigrants from Zimbabwe |
| Minimum | $18,739 | $27,656 |
| Maximum | $137,302 | $166,303 |
| Range | $118,563 | $138,647 |
| Mean | $86,036 | $86,538 |
| Median | $87,089 | $89,467 |
| Interquartile 25% (IQ1) | $73,233 | $69,146 |
| Interquartile 75% (IQ3) | $104,035 | $104,418 |
| Interquartile Range (IQR) | $30,802 | $35,272 |
| Standard Deviation (Sample) | $23,037 | $29,812 |
| Standard Deviation (Population) | $22,935 | $29,471 |
Demographics Similar to Native Hawaiians and Immigrants from Zimbabwe by Median Household Income
In terms of median household income, the demographic groups most similar to Native Hawaiians are Taiwanese ($89,900, a difference of 0.020%), Immigrants from Western Asia ($90,005, a difference of 0.10%), Syrian ($89,830, a difference of 0.10%), Immigrants from Northern Africa ($90,026, a difference of 0.12%), and Albanian ($89,744, a difference of 0.20%). Similarly, the demographic groups most similar to Immigrants from Zimbabwe are Immigrants from Jordan ($89,412, a difference of 0.090%), Ethiopian ($89,640, a difference of 0.16%), Pakistani ($89,638, a difference of 0.16%), Immigrants from Kuwait ($89,263, a difference of 0.26%), and Immigrants from North Macedonia ($89,741, a difference of 0.27%).
| Demographics | Rating | Rank | Median Household Income |
| Chileans | 97.2 /100 | #109 | Exceptional $90,605 |
| Palestinians | 97.1 /100 | #110 | Exceptional $90,574 |
| Immigrants | Poland | 97.1 /100 | #111 | Exceptional $90,549 |
| Northern Europeans | 96.9 /100 | #112 | Exceptional $90,446 |
| Peruvians | 96.5 /100 | #113 | Exceptional $90,261 |
| Immigrants | Northern Africa | 95.9 /100 | #114 | Exceptional $90,026 |
| Immigrants | Western Asia | 95.9 /100 | #115 | Exceptional $90,005 |
| Native Hawaiians | 95.7 /100 | #116 | Exceptional $89,919 |
| Taiwanese | 95.6 /100 | #117 | Exceptional $89,900 |
| Syrians | 95.4 /100 | #118 | Exceptional $89,830 |
| Albanians | 95.2 /100 | #119 | Exceptional $89,744 |
| Immigrants | North Macedonia | 95.2 /100 | #120 | Exceptional $89,741 |
| Ethiopians | 94.9 /100 | #121 | Exceptional $89,640 |
| Pakistanis | 94.8 /100 | #122 | Exceptional $89,638 |
| Immigrants | Zimbabwe | 94.4 /100 | #123 | Exceptional $89,496 |
| Immigrants | Jordan | 94.1 /100 | #124 | Exceptional $89,412 |
| Immigrants | Kuwait | 93.5 /100 | #125 | Exceptional $89,263 |
| Immigrants | Oceania | 92.9 /100 | #126 | Exceptional $89,100 |
| Immigrants | Peru | 92.5 /100 | #127 | Exceptional $89,010 |
| Portuguese | 92.3 /100 | #128 | Exceptional $88,976 |
| Brazilians | 92.1 /100 | #129 | Exceptional $88,934 |