Inupiat vs Immigrants from Zimbabwe Median Household Income
COMPARE
Inupiat
Immigrants from Zimbabwe
Median Household Income
Median Household Income Comparison
Inupiat
Immigrants from Zimbabwe
$78,841
MEDIAN HOUSEHOLD INCOME
1.8/ 100
METRIC RATING
245th/ 347
METRIC RANK
$89,496
MEDIAN HOUSEHOLD INCOME
94.4/ 100
METRIC RATING
123rd/ 347
METRIC RANK
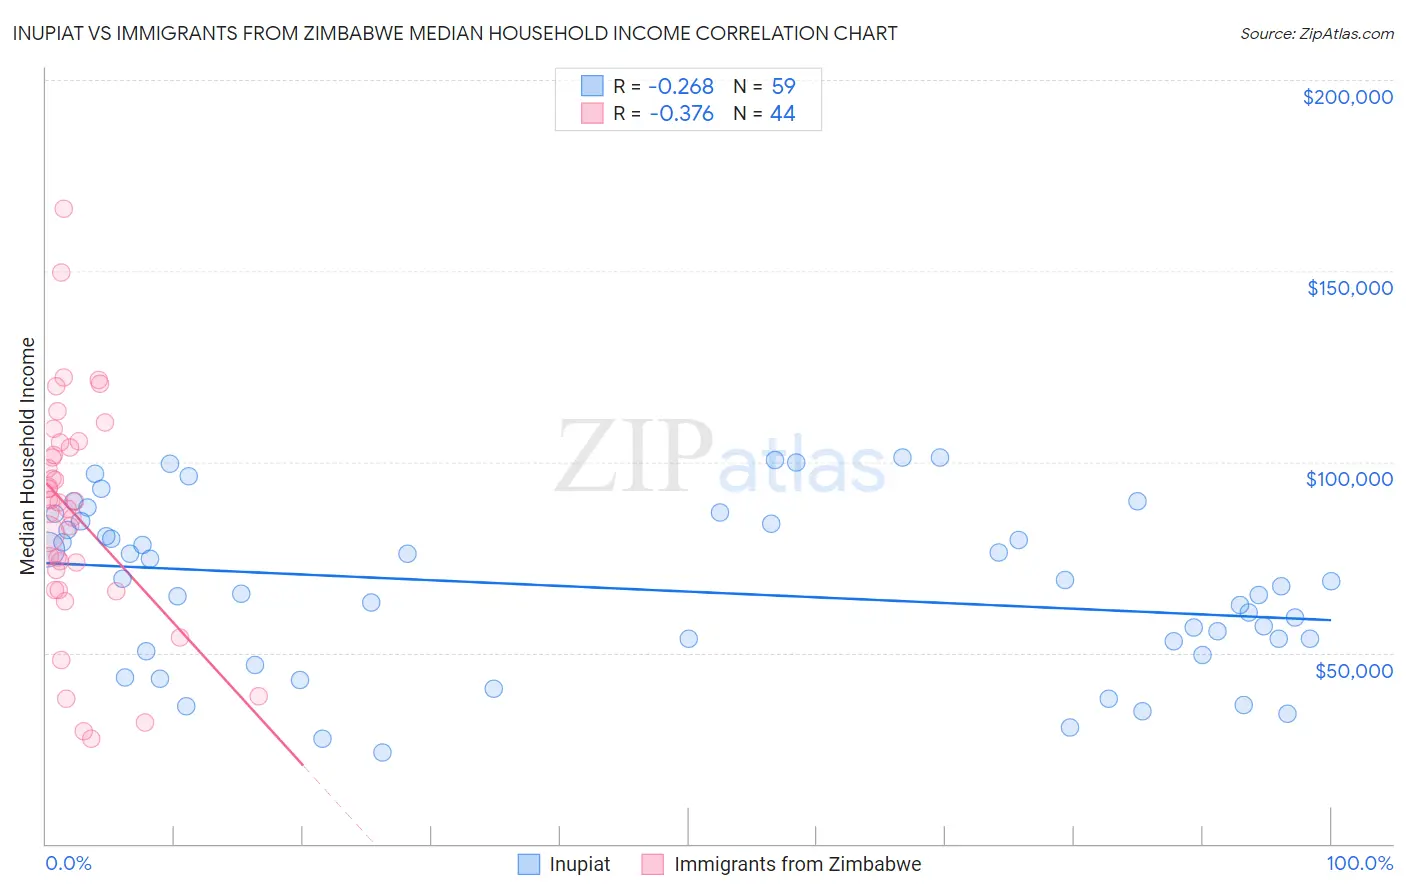
Inupiat vs Immigrants from Zimbabwe Median Household Income Correlation Chart
The statistical analysis conducted on geographies consisting of 96,314,941 people shows a weak negative correlation between the proportion of Inupiat and median household income in the United States with a correlation coefficient (R) of -0.268 and weighted average of $78,841. Similarly, the statistical analysis conducted on geographies consisting of 117,782,867 people shows a mild negative correlation between the proportion of Immigrants from Zimbabwe and median household income in the United States with a correlation coefficient (R) of -0.376 and weighted average of $89,496, a difference of 13.5%.
Median Household Income Correlation Summary
| Measurement | Inupiat | Immigrants from Zimbabwe |
| Minimum | $23,889 | $27,656 |
| Maximum | $101,071 | $166,303 |
| Range | $77,182 | $138,647 |
| Mean | $66,659 | $86,538 |
| Median | $67,500 | $89,467 |
| Interquartile 25% (IQ1) | $50,572 | $69,146 |
| Interquartile 75% (IQ3) | $83,750 | $104,418 |
| Interquartile Range (IQR) | $33,178 | $35,272 |
| Standard Deviation (Sample) | $21,353 | $29,812 |
| Standard Deviation (Population) | $21,171 | $29,471 |
Similar Demographics by Median Household Income
Demographics Similar to Inupiat by Median Household Income
In terms of median household income, the demographic groups most similar to Inupiat are Central American ($78,803, a difference of 0.050%), Marshallese ($78,930, a difference of 0.11%), Immigrants from Barbados ($78,989, a difference of 0.19%), Immigrants from Burma/Myanmar ($78,682, a difference of 0.20%), and Immigrants from Sudan ($79,103, a difference of 0.33%).
| Demographics | Rating | Rank | Median Household Income |
| Barbadians | 3.0 /100 | #238 | Tragic $79,664 |
| Alaska Natives | 2.7 /100 | #239 | Tragic $79,509 |
| Immigrants | Western Africa | 2.7 /100 | #240 | Tragic $79,490 |
| Immigrants | Nonimmigrants | 2.6 /100 | #241 | Tragic $79,429 |
| Immigrants | Sudan | 2.1 /100 | #242 | Tragic $79,103 |
| Immigrants | Barbados | 1.9 /100 | #243 | Tragic $78,989 |
| Marshallese | 1.9 /100 | #244 | Tragic $78,930 |
| Inupiat | 1.8 /100 | #245 | Tragic $78,841 |
| Central Americans | 1.7 /100 | #246 | Tragic $78,803 |
| Immigrants | Burma/Myanmar | 1.6 /100 | #247 | Tragic $78,682 |
| Sudanese | 1.5 /100 | #248 | Tragic $78,529 |
| West Indians | 1.4 /100 | #249 | Tragic $78,455 |
| Immigrants | Laos | 1.3 /100 | #250 | Tragic $78,327 |
| Mexican American Indians | 1.2 /100 | #251 | Tragic $78,166 |
| Immigrants | West Indies | 1.0 /100 | #252 | Tragic $77,956 |
Demographics Similar to Immigrants from Zimbabwe by Median Household Income
In terms of median household income, the demographic groups most similar to Immigrants from Zimbabwe are Immigrants from Jordan ($89,412, a difference of 0.090%), Ethiopian ($89,640, a difference of 0.16%), Pakistani ($89,638, a difference of 0.16%), Immigrants from Kuwait ($89,263, a difference of 0.26%), and Immigrants from North Macedonia ($89,741, a difference of 0.27%).
| Demographics | Rating | Rank | Median Household Income |
| Native Hawaiians | 95.7 /100 | #116 | Exceptional $89,919 |
| Taiwanese | 95.6 /100 | #117 | Exceptional $89,900 |
| Syrians | 95.4 /100 | #118 | Exceptional $89,830 |
| Albanians | 95.2 /100 | #119 | Exceptional $89,744 |
| Immigrants | North Macedonia | 95.2 /100 | #120 | Exceptional $89,741 |
| Ethiopians | 94.9 /100 | #121 | Exceptional $89,640 |
| Pakistanis | 94.8 /100 | #122 | Exceptional $89,638 |
| Immigrants | Zimbabwe | 94.4 /100 | #123 | Exceptional $89,496 |
| Immigrants | Jordan | 94.1 /100 | #124 | Exceptional $89,412 |
| Immigrants | Kuwait | 93.5 /100 | #125 | Exceptional $89,263 |
| Immigrants | Oceania | 92.9 /100 | #126 | Exceptional $89,100 |
| Immigrants | Peru | 92.5 /100 | #127 | Exceptional $89,010 |
| Portuguese | 92.3 /100 | #128 | Exceptional $88,976 |
| Brazilians | 92.1 /100 | #129 | Exceptional $88,934 |
| British | 92.0 /100 | #130 | Exceptional $88,914 |