Okinawan vs Hispanic or Latino Median Household Income
COMPARE
Okinawan
Hispanic or Latino
Median Household Income
Median Household Income Comparison
Okinawans
Hispanics or Latinos
$106,624
MEDIAN HOUSEHOLD INCOME
100.0/ 100
METRIC RATING
9th/ 347
METRIC RANK
$73,823
MEDIAN HOUSEHOLD INCOME
0.1/ 100
METRIC RATING
291st/ 347
METRIC RANK
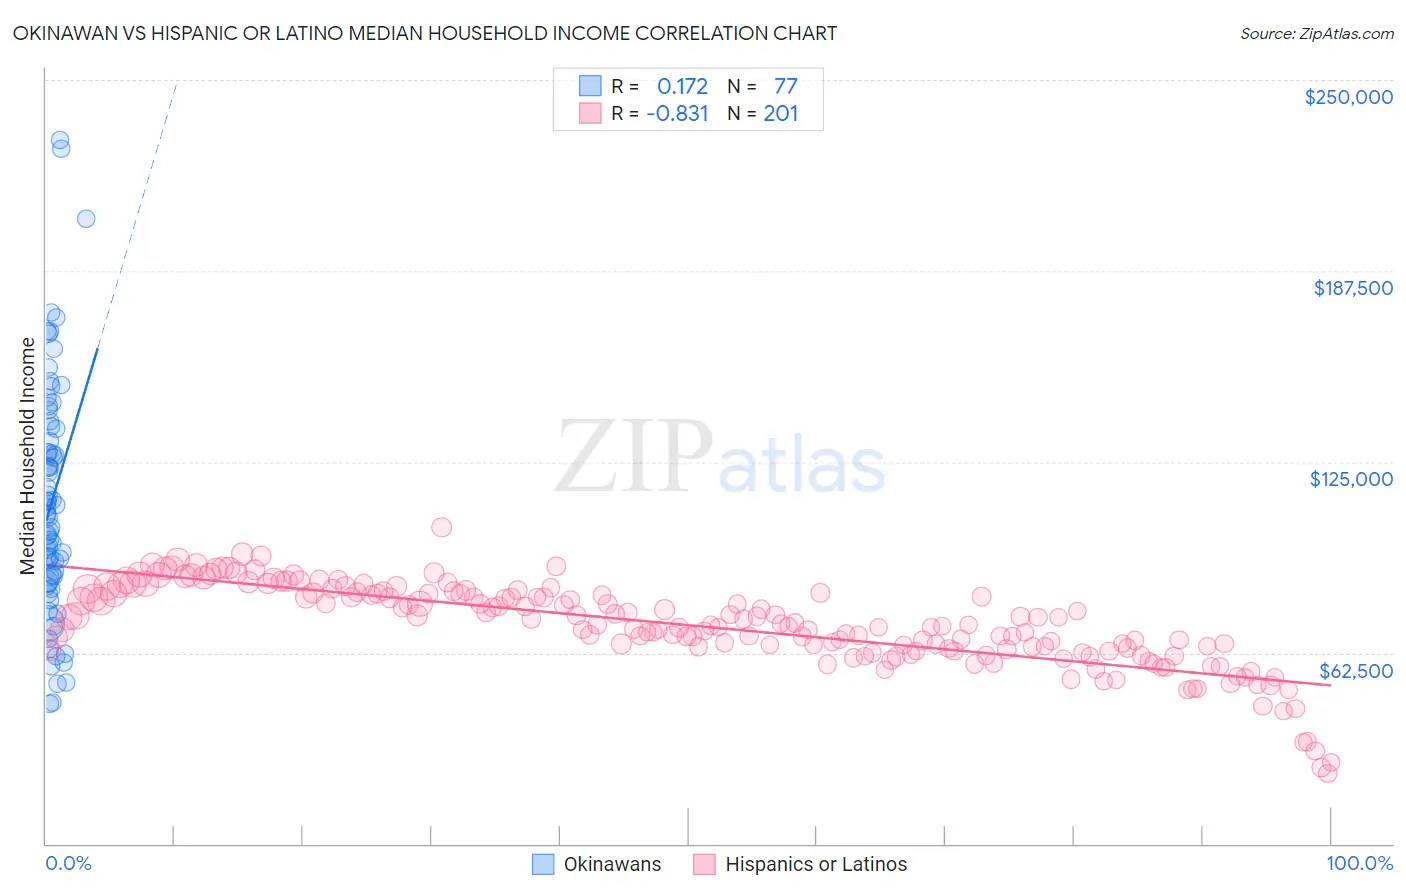
Okinawan vs Hispanic or Latino Median Household Income Correlation Chart
The statistical analysis conducted on geographies consisting of 73,710,958 people shows a poor positive correlation between the proportion of Okinawans and median household income in the United States with a correlation coefficient (R) of 0.172 and weighted average of $106,624. Similarly, the statistical analysis conducted on geographies consisting of 577,204,907 people shows a very strong negative correlation between the proportion of Hispanics or Latinos and median household income in the United States with a correlation coefficient (R) of -0.831 and weighted average of $73,823, a difference of 44.4%.
Median Household Income Correlation Summary
| Measurement | Okinawan | Hispanic or Latino |
| Minimum | $46,026 | $23,087 |
| Maximum | $230,434 | $103,536 |
| Range | $184,408 | $80,449 |
| Mean | $112,091 | $71,424 |
| Median | $107,483 | $71,562 |
| Interquartile 25% (IQ1) | $86,369 | $63,567 |
| Interquartile 75% (IQ3) | $136,400 | $81,961 |
| Interquartile Range (IQR) | $50,031 | $18,394 |
| Standard Deviation (Sample) | $39,077 | $13,788 |
| Standard Deviation (Population) | $38,823 | $13,754 |
Similar Demographics by Median Household Income
Demographics Similar to Okinawans by Median Household Income
In terms of median household income, the demographic groups most similar to Okinawans are Immigrants from South Central Asia ($106,057, a difference of 0.53%), Immigrants from China ($105,335, a difference of 1.2%), Indian (Asian) ($105,262, a difference of 1.3%), Immigrants from Iran ($108,055, a difference of 1.3%), and Immigrants from Eastern Asia ($104,796, a difference of 1.7%).
| Demographics | Rating | Rank | Median Household Income |
| Filipinos | 100.0 /100 | #2 | Exceptional $115,509 |
| Immigrants | India | 100.0 /100 | #3 | Exceptional $113,009 |
| Immigrants | Hong Kong | 100.0 /100 | #4 | Exceptional $111,519 |
| Thais | 100.0 /100 | #5 | Exceptional $110,648 |
| Immigrants | Singapore | 100.0 /100 | #6 | Exceptional $110,428 |
| Iranians | 100.0 /100 | #7 | Exceptional $109,835 |
| Immigrants | Iran | 100.0 /100 | #8 | Exceptional $108,055 |
| Okinawans | 100.0 /100 | #9 | Exceptional $106,624 |
| Immigrants | South Central Asia | 100.0 /100 | #10 | Exceptional $106,057 |
| Immigrants | China | 100.0 /100 | #11 | Exceptional $105,335 |
| Indians (Asian) | 100.0 /100 | #12 | Exceptional $105,262 |
| Immigrants | Eastern Asia | 100.0 /100 | #13 | Exceptional $104,796 |
| Immigrants | Ireland | 100.0 /100 | #14 | Exceptional $104,692 |
| Immigrants | Israel | 100.0 /100 | #15 | Exceptional $104,090 |
| Burmese | 100.0 /100 | #16 | Exceptional $103,145 |
Demographics Similar to Hispanics or Latinos by Median Household Income
In terms of median household income, the demographic groups most similar to Hispanics or Latinos are Comanche ($73,747, a difference of 0.10%), Bangladeshi ($74,112, a difference of 0.39%), Immigrants from Cabo Verde ($73,515, a difference of 0.42%), Blackfeet ($73,509, a difference of 0.43%), and Fijian ($74,205, a difference of 0.52%).
| Demographics | Rating | Rank | Median Household Income |
| Yaqui | 0.1 /100 | #284 | Tragic $74,596 |
| Mexicans | 0.1 /100 | #285 | Tragic $74,399 |
| Immigrants | Somalia | 0.1 /100 | #286 | Tragic $74,300 |
| Iroquois | 0.1 /100 | #287 | Tragic $74,279 |
| Immigrants | Central America | 0.1 /100 | #288 | Tragic $74,217 |
| Fijians | 0.1 /100 | #289 | Tragic $74,205 |
| Bangladeshis | 0.1 /100 | #290 | Tragic $74,112 |
| Hispanics or Latinos | 0.1 /100 | #291 | Tragic $73,823 |
| Comanche | 0.1 /100 | #292 | Tragic $73,747 |
| Immigrants | Cabo Verde | 0.1 /100 | #293 | Tragic $73,515 |
| Blackfeet | 0.1 /100 | #294 | Tragic $73,509 |
| Cubans | 0.1 /100 | #295 | Tragic $73,392 |
| Haitians | 0.1 /100 | #296 | Tragic $73,306 |
| Immigrants | Mexico | 0.0 /100 | #297 | Tragic $73,160 |
| Paiute | 0.0 /100 | #298 | Tragic $72,959 |