Northern European vs Honduran Wage/Income Gap
COMPARE
Northern European
Honduran
Wage/Income Gap
Wage/Income Gap Comparison
Northern Europeans
Hondurans
28.3%
WAGE/INCOME GAP
0.3/ 100
METRIC RATING
296th/ 347
METRIC RANK
23.6%
WAGE/INCOME GAP
99.5/ 100
METRIC RATING
94th/ 347
METRIC RANK
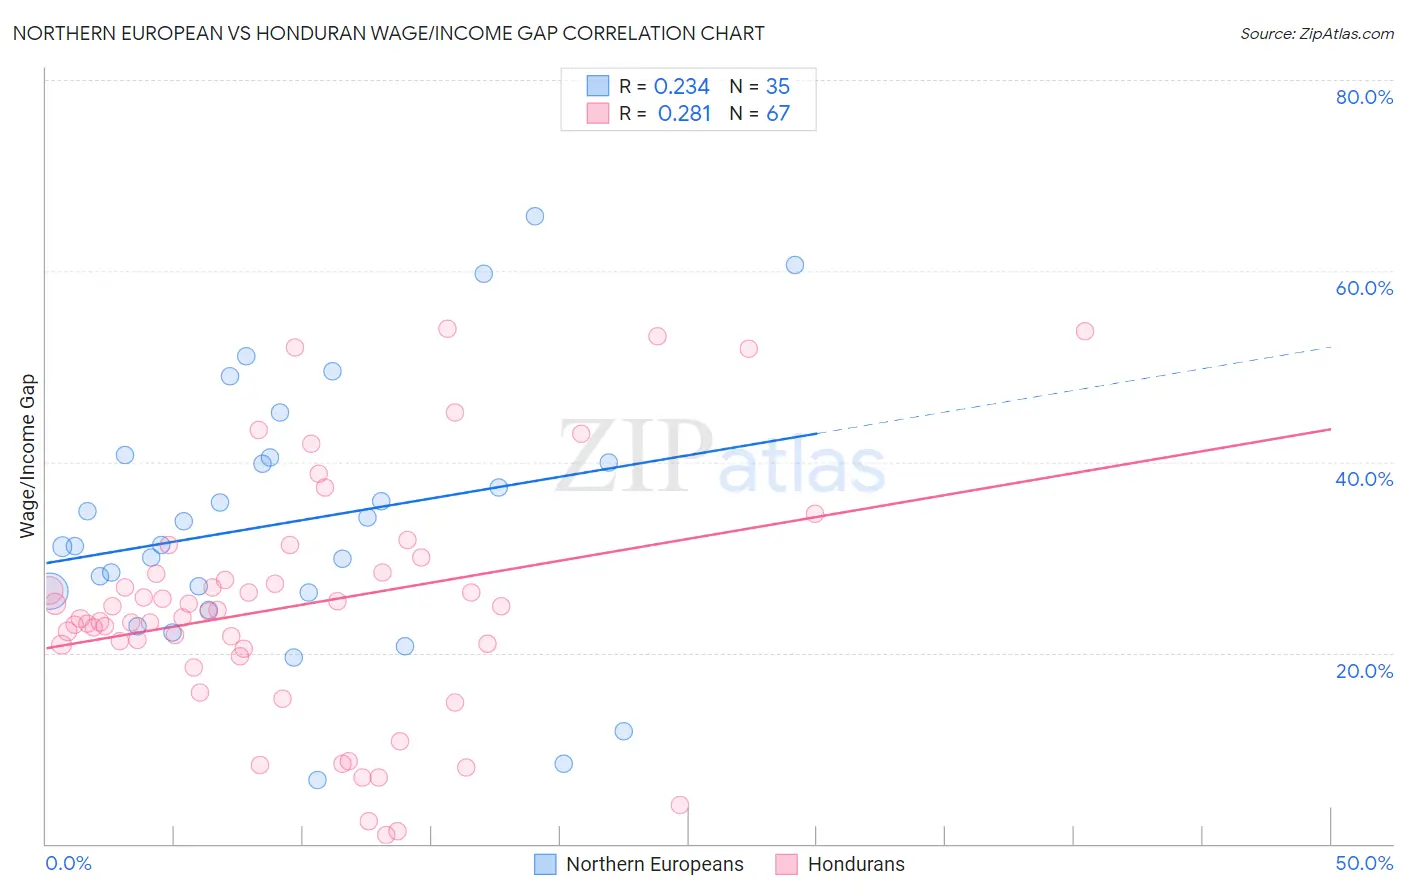
Northern European vs Honduran Wage/Income Gap Correlation Chart
The statistical analysis conducted on geographies consisting of 405,582,717 people shows a weak positive correlation between the proportion of Northern Europeans and wage/income gap percentage in the United States with a correlation coefficient (R) of 0.234 and weighted average of 28.3%. Similarly, the statistical analysis conducted on geographies consisting of 357,631,744 people shows a weak positive correlation between the proportion of Hondurans and wage/income gap percentage in the United States with a correlation coefficient (R) of 0.281 and weighted average of 23.6%, a difference of 20.0%.
Wage/Income Gap Correlation Summary
| Measurement | Northern European | Honduran |
| Minimum | 6.7% | 0.90% |
| Maximum | 65.7% | 53.9% |
| Range | 59.0% | 53.0% |
| Mean | 33.7% | 25.0% |
| Median | 31.3% | 24.4% |
| Interquartile 25% (IQ1) | 26.3% | 20.4% |
| Interquartile 75% (IQ3) | 40.5% | 28.4% |
| Interquartile Range (IQR) | 14.2% | 8.0% |
| Standard Deviation (Sample) | 13.7% | 12.6% |
| Standard Deviation (Population) | 13.5% | 12.5% |
Similar Demographics by Wage/Income Gap
Demographics Similar to Northern Europeans by Wage/Income Gap
In terms of wage/income gap, the demographic groups most similar to Northern Europeans are Slovene (28.3%, a difference of 0.0%), Greek (28.2%, a difference of 0.13%), Immigrants from Israel (28.2%, a difference of 0.16%), Immigrants from Australia (28.2%, a difference of 0.27%), and Czechoslovakian (28.2%, a difference of 0.32%).
| Demographics | Rating | Rank | Wage/Income Gap |
| Canadians | 0.3 /100 | #289 | Tragic 28.1% |
| Australians | 0.3 /100 | #290 | Tragic 28.2% |
| Czechoslovakians | 0.3 /100 | #291 | Tragic 28.2% |
| Immigrants | Australia | 0.3 /100 | #292 | Tragic 28.2% |
| Immigrants | Israel | 0.3 /100 | #293 | Tragic 28.2% |
| Greeks | 0.3 /100 | #294 | Tragic 28.2% |
| Slovenes | 0.3 /100 | #295 | Tragic 28.3% |
| Northern Europeans | 0.3 /100 | #296 | Tragic 28.3% |
| Immigrants | North America | 0.2 /100 | #297 | Tragic 28.4% |
| Austrians | 0.2 /100 | #298 | Tragic 28.4% |
| Immigrants | North Macedonia | 0.2 /100 | #299 | Tragic 28.4% |
| Immigrants | Northern Europe | 0.2 /100 | #300 | Tragic 28.5% |
| Immigrants | Canada | 0.2 /100 | #301 | Tragic 28.5% |
| Scotch-Irish | 0.2 /100 | #302 | Tragic 28.5% |
| Irish | 0.2 /100 | #303 | Tragic 28.5% |
Demographics Similar to Hondurans by Wage/Income Gap
In terms of wage/income gap, the demographic groups most similar to Hondurans are Cape Verdean (23.6%, a difference of 0.030%), Immigrants from Cabo Verde (23.6%, a difference of 0.090%), Kiowa (23.6%, a difference of 0.15%), Immigrants from Sudan (23.6%, a difference of 0.24%), and Immigrants from Honduras (23.5%, a difference of 0.33%).
| Demographics | Rating | Rank | Wage/Income Gap |
| Yuman | 99.7 /100 | #87 | Exceptional 23.3% |
| Immigrants | Panama | 99.6 /100 | #88 | Exceptional 23.4% |
| Marshallese | 99.6 /100 | #89 | Exceptional 23.4% |
| Nicaraguans | 99.6 /100 | #90 | Exceptional 23.4% |
| Arapaho | 99.6 /100 | #91 | Exceptional 23.5% |
| Immigrants | Honduras | 99.5 /100 | #92 | Exceptional 23.5% |
| Immigrants | Cabo Verde | 99.5 /100 | #93 | Exceptional 23.6% |
| Hondurans | 99.5 /100 | #94 | Exceptional 23.6% |
| Cape Verdeans | 99.4 /100 | #95 | Exceptional 23.6% |
| Kiowa | 99.4 /100 | #96 | Exceptional 23.6% |
| Immigrants | Sudan | 99.4 /100 | #97 | Exceptional 23.6% |
| Immigrants | Latin America | 99.2 /100 | #98 | Exceptional 23.7% |
| Aleuts | 99.2 /100 | #99 | Exceptional 23.7% |
| Yakama | 99.2 /100 | #100 | Exceptional 23.7% |
| Japanese | 99.1 /100 | #101 | Exceptional 23.8% |