Northern European vs Immigrants from Argentina Wage/Income Gap
COMPARE
Northern European
Immigrants from Argentina
Wage/Income Gap
Wage/Income Gap Comparison
Northern Europeans
Immigrants from Argentina
28.3%
WAGE/INCOME GAP
0.3/ 100
METRIC RATING
296th/ 347
METRIC RANK
26.8%
WAGE/INCOME GAP
7.2/ 100
METRIC RATING
224th/ 347
METRIC RANK
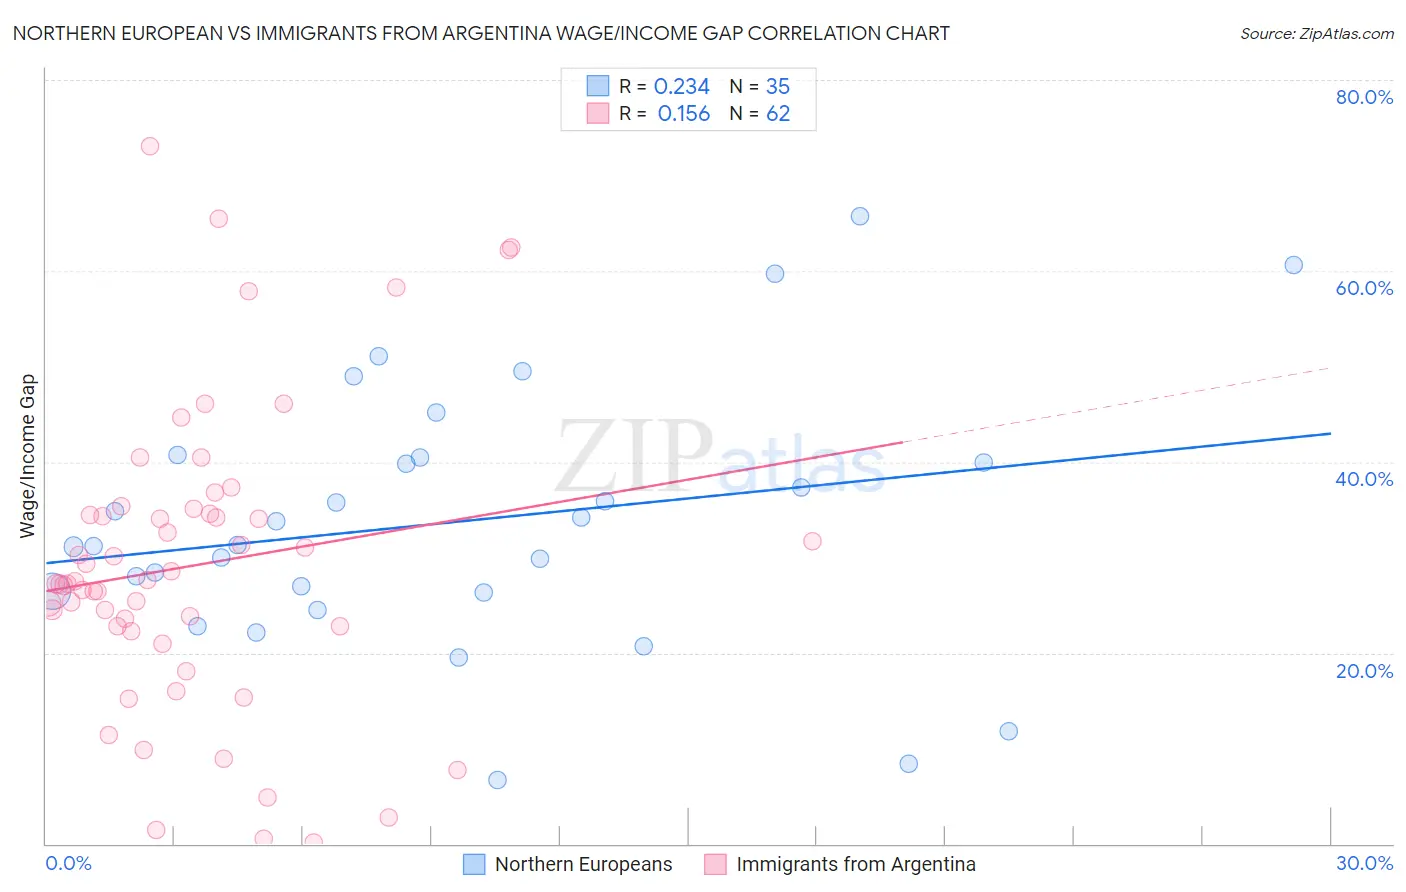
Northern European vs Immigrants from Argentina Wage/Income Gap Correlation Chart
The statistical analysis conducted on geographies consisting of 405,582,717 people shows a weak positive correlation between the proportion of Northern Europeans and wage/income gap percentage in the United States with a correlation coefficient (R) of 0.234 and weighted average of 28.3%. Similarly, the statistical analysis conducted on geographies consisting of 264,345,547 people shows a poor positive correlation between the proportion of Immigrants from Argentina and wage/income gap percentage in the United States with a correlation coefficient (R) of 0.156 and weighted average of 26.8%, a difference of 5.4%.
Wage/Income Gap Correlation Summary
| Measurement | Northern European | Immigrants from Argentina |
| Minimum | 6.7% | 0.074% |
| Maximum | 65.7% | 73.0% |
| Range | 59.0% | 73.0% |
| Mean | 33.7% | 29.2% |
| Median | 31.3% | 27.4% |
| Interquartile 25% (IQ1) | 26.3% | 22.7% |
| Interquartile 75% (IQ3) | 40.5% | 34.6% |
| Interquartile Range (IQR) | 14.2% | 11.9% |
| Standard Deviation (Sample) | 13.7% | 15.6% |
| Standard Deviation (Population) | 13.5% | 15.5% |
Similar Demographics by Wage/Income Gap
Demographics Similar to Northern Europeans by Wage/Income Gap
In terms of wage/income gap, the demographic groups most similar to Northern Europeans are Slovene (28.3%, a difference of 0.0%), Greek (28.2%, a difference of 0.13%), Immigrants from Israel (28.2%, a difference of 0.16%), Immigrants from Australia (28.2%, a difference of 0.27%), and Czechoslovakian (28.2%, a difference of 0.32%).
| Demographics | Rating | Rank | Wage/Income Gap |
| Canadians | 0.3 /100 | #289 | Tragic 28.1% |
| Australians | 0.3 /100 | #290 | Tragic 28.2% |
| Czechoslovakians | 0.3 /100 | #291 | Tragic 28.2% |
| Immigrants | Australia | 0.3 /100 | #292 | Tragic 28.2% |
| Immigrants | Israel | 0.3 /100 | #293 | Tragic 28.2% |
| Greeks | 0.3 /100 | #294 | Tragic 28.2% |
| Slovenes | 0.3 /100 | #295 | Tragic 28.3% |
| Northern Europeans | 0.3 /100 | #296 | Tragic 28.3% |
| Immigrants | North America | 0.2 /100 | #297 | Tragic 28.4% |
| Austrians | 0.2 /100 | #298 | Tragic 28.4% |
| Immigrants | North Macedonia | 0.2 /100 | #299 | Tragic 28.4% |
| Immigrants | Northern Europe | 0.2 /100 | #300 | Tragic 28.5% |
| Immigrants | Canada | 0.2 /100 | #301 | Tragic 28.5% |
| Scotch-Irish | 0.2 /100 | #302 | Tragic 28.5% |
| Irish | 0.2 /100 | #303 | Tragic 28.5% |
Demographics Similar to Immigrants from Argentina by Wage/Income Gap
In terms of wage/income gap, the demographic groups most similar to Immigrants from Argentina are Jordanian (26.8%, a difference of 0.17%), Immigrants from Ireland (26.9%, a difference of 0.17%), Bolivian (26.8%, a difference of 0.25%), Immigrants from Spain (26.8%, a difference of 0.28%), and Asian (26.9%, a difference of 0.33%).
| Demographics | Rating | Rank | Wage/Income Gap |
| Brazilians | 9.2 /100 | #217 | Tragic 26.7% |
| Immigrants | Saudi Arabia | 9.1 /100 | #218 | Tragic 26.7% |
| Immigrants | Poland | 8.9 /100 | #219 | Tragic 26.7% |
| Immigrants | Latvia | 8.9 /100 | #220 | Tragic 26.7% |
| Immigrants | Spain | 8.5 /100 | #221 | Tragic 26.8% |
| Bolivians | 8.3 /100 | #222 | Tragic 26.8% |
| Jordanians | 8.0 /100 | #223 | Tragic 26.8% |
| Immigrants | Argentina | 7.2 /100 | #224 | Tragic 26.8% |
| Immigrants | Ireland | 6.5 /100 | #225 | Tragic 26.9% |
| Asians | 5.9 /100 | #226 | Tragic 26.9% |
| Spaniards | 5.6 /100 | #227 | Tragic 27.0% |
| Immigrants | Turkey | 5.6 /100 | #228 | Tragic 27.0% |
| Immigrants | Asia | 5.5 /100 | #229 | Tragic 27.0% |
| Ottawa | 5.3 /100 | #230 | Tragic 27.0% |
| Bhutanese | 5.3 /100 | #231 | Tragic 27.0% |