Northern European vs Honduran Family Households
COMPARE
Northern European
Honduran
Family Households
Family Households Comparison
Northern Europeans
Hondurans
64.1%
FAMILY HOUSEHOLDS
28.2/ 100
METRIC RATING
187th/ 347
METRIC RANK
64.4%
FAMILY HOUSEHOLDS
57.5/ 100
METRIC RATING
168th/ 347
METRIC RANK
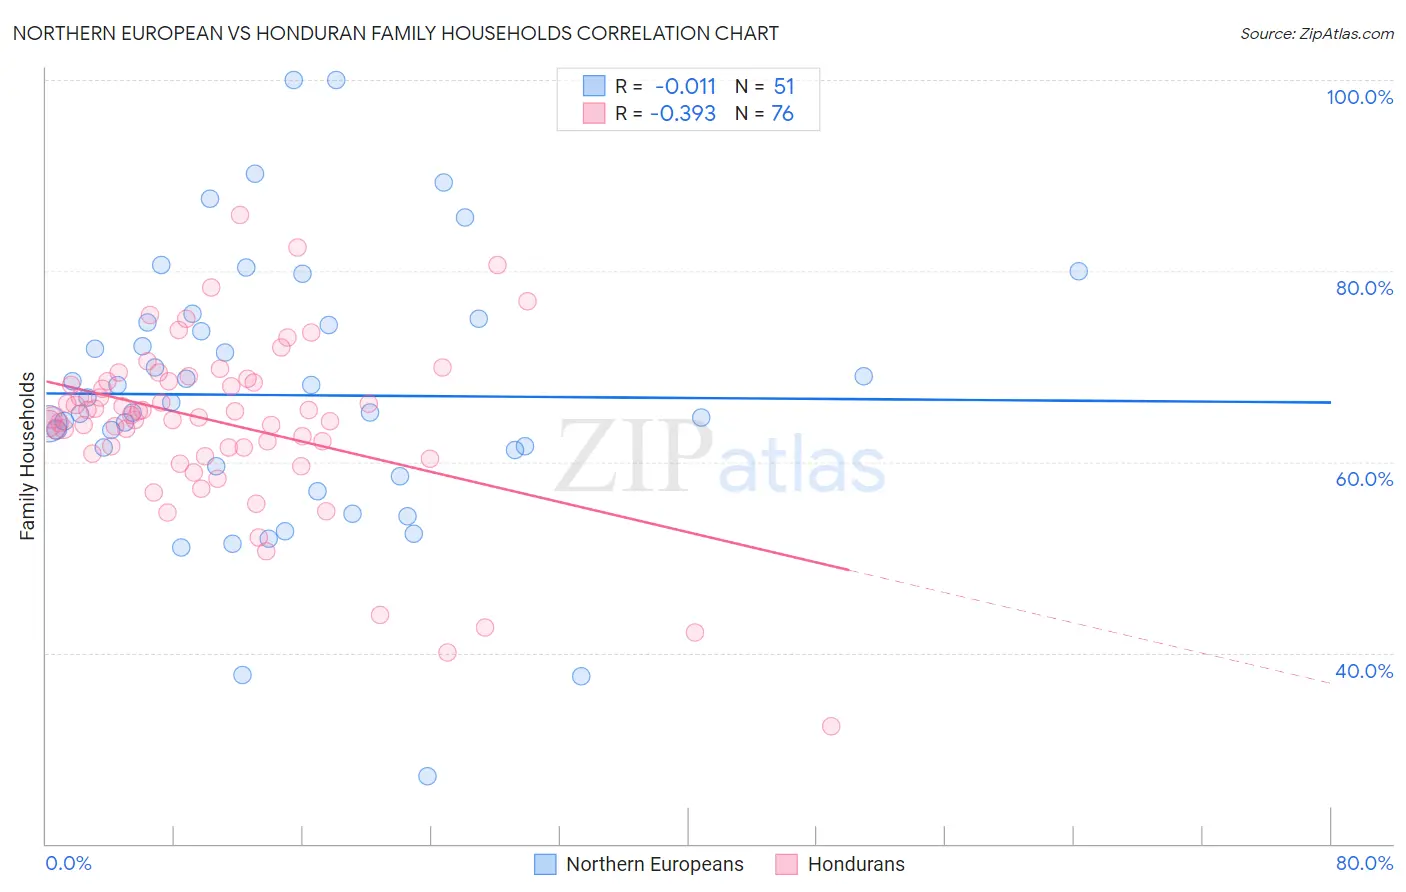
Northern European vs Honduran Family Households Correlation Chart
The statistical analysis conducted on geographies consisting of 405,947,196 people shows no correlation between the proportion of Northern Europeans and percentage of family households in the United States with a correlation coefficient (R) of -0.011 and weighted average of 64.1%. Similarly, the statistical analysis conducted on geographies consisting of 357,606,635 people shows a mild negative correlation between the proportion of Hondurans and percentage of family households in the United States with a correlation coefficient (R) of -0.393 and weighted average of 64.4%, a difference of 0.42%.
Family Households Correlation Summary
| Measurement | Northern European | Honduran |
| Minimum | 27.1% | 32.4% |
| Maximum | 100.0% | 85.8% |
| Range | 72.9% | 53.5% |
| Mean | 67.0% | 64.1% |
| Median | 66.2% | 64.8% |
| Interquartile 25% (IQ1) | 59.5% | 61.2% |
| Interquartile 75% (IQ3) | 74.7% | 68.5% |
| Interquartile Range (IQR) | 15.1% | 7.3% |
| Standard Deviation (Sample) | 14.3% | 9.1% |
| Standard Deviation (Population) | 14.2% | 9.0% |
Demographics Similar to Northern Europeans and Hondurans by Family Households
In terms of family households, the demographic groups most similar to Northern Europeans are Spanish American (64.1%, a difference of 0.030%), Immigrants from Iran (64.1%, a difference of 0.040%), Puerto Rican (64.2%, a difference of 0.080%), Creek (64.2%, a difference of 0.090%), and Immigrants from Trinidad and Tobago (64.2%, a difference of 0.10%). Similarly, the demographic groups most similar to Hondurans are Irish (64.4%, a difference of 0.010%), Iraqi (64.4%, a difference of 0.020%), Armenian (64.4%, a difference of 0.020%), Ute (64.3%, a difference of 0.040%), and Dutch West Indian (64.3%, a difference of 0.050%).
| Demographics | Rating | Rank | Family Households |
| Irish | 57.9 /100 | #167 | Average 64.4% |
| Hondurans | 57.5 /100 | #168 | Average 64.4% |
| Iraqis | 56.0 /100 | #169 | Average 64.4% |
| Armenians | 55.9 /100 | #170 | Average 64.4% |
| Ute | 54.6 /100 | #171 | Average 64.3% |
| Dutch West Indians | 53.9 /100 | #172 | Average 64.3% |
| Immigrants | Sierra Leone | 52.5 /100 | #173 | Average 64.3% |
| Immigrants | Germany | 50.0 /100 | #174 | Average 64.3% |
| Bangladeshis | 44.3 /100 | #175 | Average 64.3% |
| Vietnamese | 43.6 /100 | #176 | Average 64.2% |
| Immigrants | Micronesia | 42.3 /100 | #177 | Average 64.2% |
| Jamaicans | 40.6 /100 | #178 | Average 64.2% |
| Immigrants | Ukraine | 38.2 /100 | #179 | Fair 64.2% |
| Immigrants | Honduras | 35.0 /100 | #180 | Fair 64.2% |
| Immigrants | Trinidad and Tobago | 34.9 /100 | #181 | Fair 64.2% |
| Ukrainians | 34.6 /100 | #182 | Fair 64.2% |
| Creek | 34.1 /100 | #183 | Fair 64.2% |
| Puerto Ricans | 33.4 /100 | #184 | Fair 64.2% |
| Immigrants | Iran | 30.4 /100 | #185 | Fair 64.1% |
| Spanish Americans | 30.1 /100 | #186 | Fair 64.1% |
| Northern Europeans | 28.2 /100 | #187 | Fair 64.1% |