Navajo vs Comanche Per Capita Income
COMPARE
Navajo
Comanche
Per Capita Income
Per Capita Income Comparison
Navajo
Comanche
$29,031
PER CAPITA INCOME
0.0/ 100
METRIC RATING
347th/ 347
METRIC RANK
$38,088
PER CAPITA INCOME
0.2/ 100
METRIC RATING
277th/ 347
METRIC RANK
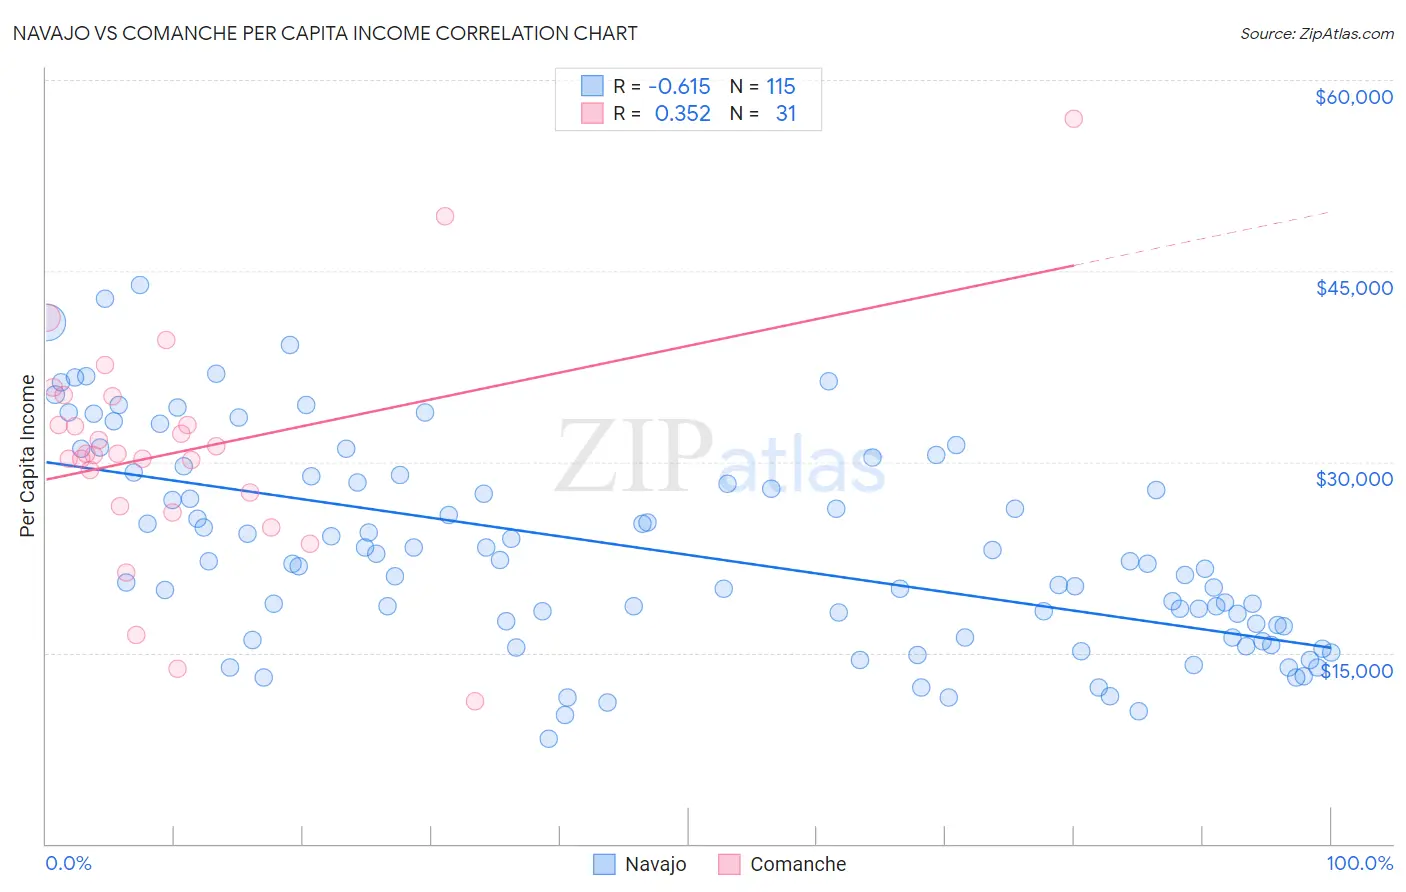
Navajo vs Comanche Per Capita Income Correlation Chart
The statistical analysis conducted on geographies consisting of 224,872,448 people shows a significant negative correlation between the proportion of Navajo and per capita income in the United States with a correlation coefficient (R) of -0.615 and weighted average of $29,031. Similarly, the statistical analysis conducted on geographies consisting of 109,786,530 people shows a mild positive correlation between the proportion of Comanche and per capita income in the United States with a correlation coefficient (R) of 0.352 and weighted average of $38,088, a difference of 31.2%.
Per Capita Income Correlation Summary
| Measurement | Navajo | Comanche |
| Minimum | $8,247 | $11,178 |
| Maximum | $43,851 | $56,980 |
| Range | $35,604 | $45,802 |
| Mean | $22,991 | $30,910 |
| Median | $21,965 | $30,680 |
| Interquartile 25% (IQ1) | $16,235 | $26,547 |
| Interquartile 75% (IQ3) | $28,907 | $35,132 |
| Interquartile Range (IQR) | $12,672 | $8,585 |
| Standard Deviation (Sample) | $8,079 | $9,053 |
| Standard Deviation (Population) | $8,043 | $8,906 |
Similar Demographics by Per Capita Income
Demographics Similar to Navajo by Per Capita Income
In terms of per capita income, the demographic groups most similar to Navajo are Lumbee ($29,845, a difference of 2.8%), Tohono O'odham ($30,256, a difference of 4.2%), Yup'ik ($30,518, a difference of 5.1%), Pima ($30,644, a difference of 5.6%), and Hopi ($31,177, a difference of 7.4%).
| Demographics | Rating | Rank | Per Capita Income |
| Immigrants | Yemen | 0.0 /100 | #333 | Tragic $33,696 |
| Natives/Alaskans | 0.0 /100 | #334 | Tragic $33,279 |
| Yuman | 0.0 /100 | #335 | Tragic $33,236 |
| Yakama | 0.0 /100 | #336 | Tragic $33,009 |
| Houma | 0.0 /100 | #337 | Tragic $32,996 |
| Arapaho | 0.0 /100 | #338 | Tragic $32,345 |
| Pueblo | 0.0 /100 | #339 | Tragic $32,012 |
| Crow | 0.0 /100 | #340 | Tragic $31,729 |
| Puerto Ricans | 0.0 /100 | #341 | Tragic $31,268 |
| Hopi | 0.0 /100 | #342 | Tragic $31,177 |
| Pima | 0.0 /100 | #343 | Tragic $30,644 |
| Yup'ik | 0.0 /100 | #344 | Tragic $30,518 |
| Tohono O'odham | 0.0 /100 | #345 | Tragic $30,256 |
| Lumbee | 0.0 /100 | #346 | Tragic $29,845 |
| Navajo | 0.0 /100 | #347 | Tragic $29,031 |
Demographics Similar to Comanche by Per Capita Income
In terms of per capita income, the demographic groups most similar to Comanche are Immigrants from Nicaragua ($38,065, a difference of 0.060%), Hmong ($38,120, a difference of 0.080%), Colville ($38,047, a difference of 0.11%), Potawatomi ($38,046, a difference of 0.11%), and Immigrants from Liberia ($38,165, a difference of 0.20%).
| Demographics | Rating | Rank | Per Capita Income |
| Immigrants | Belize | 0.3 /100 | #270 | Tragic $38,614 |
| Central Americans | 0.3 /100 | #271 | Tragic $38,560 |
| Immigrants | Cabo Verde | 0.3 /100 | #272 | Tragic $38,540 |
| Nepalese | 0.3 /100 | #273 | Tragic $38,442 |
| Immigrants | El Salvador | 0.3 /100 | #274 | Tragic $38,394 |
| Immigrants | Liberia | 0.2 /100 | #275 | Tragic $38,165 |
| Hmong | 0.2 /100 | #276 | Tragic $38,120 |
| Comanche | 0.2 /100 | #277 | Tragic $38,088 |
| Immigrants | Nicaragua | 0.2 /100 | #278 | Tragic $38,065 |
| Colville | 0.2 /100 | #279 | Tragic $38,047 |
| Potawatomi | 0.2 /100 | #280 | Tragic $38,046 |
| Immigrants | Dominica | 0.2 /100 | #281 | Tragic $37,952 |
| Immigrants | Laos | 0.1 /100 | #282 | Tragic $37,857 |
| Pennsylvania Germans | 0.1 /100 | #283 | Tragic $37,842 |
| Africans | 0.1 /100 | #284 | Tragic $37,785 |