Navajo vs Soviet Union Unemployment Among Ages 16 to 19 years
COMPARE
Navajo
Soviet Union
Unemployment Among Ages 16 to 19 years
Unemployment Among Ages 16 to 19 years Comparison
Navajo
Soviet Union
29.0%
UNEMPLOYMENT AMONG AGES 16 TO 19 YEARS
0.0/ 100
METRIC RATING
343rd/ 347
METRIC RANK
16.8%
UNEMPLOYMENT AMONG AGES 16 TO 19 YEARS
97.8/ 100
METRIC RATING
78th/ 347
METRIC RANK
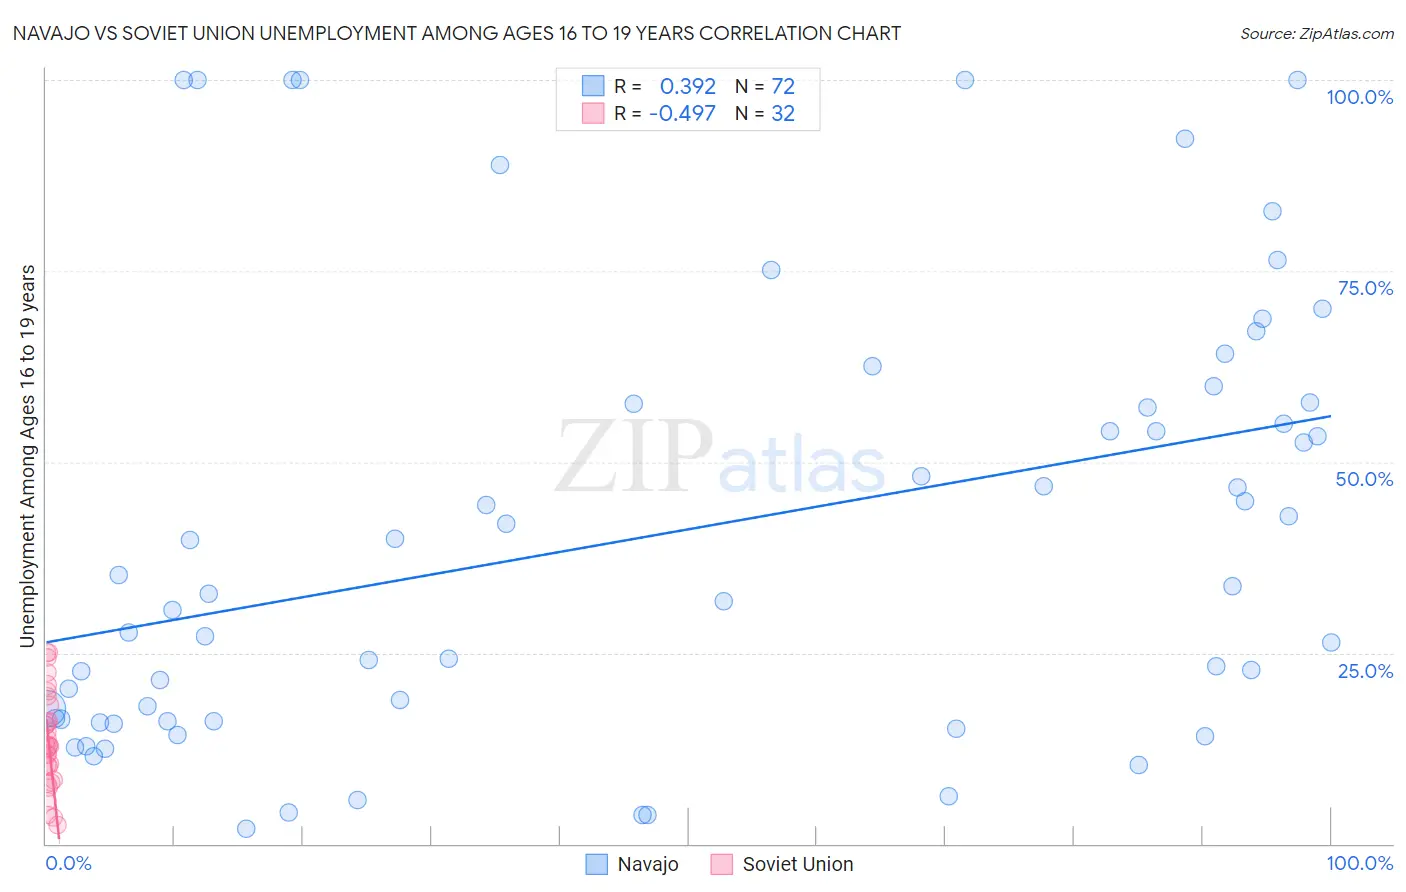
Navajo vs Soviet Union Unemployment Among Ages 16 to 19 years Correlation Chart
The statistical analysis conducted on geographies consisting of 218,309,050 people shows a mild positive correlation between the proportion of Navajo and unemployment rate among population between the ages 16 and 19 in the United States with a correlation coefficient (R) of 0.392 and weighted average of 29.0%. Similarly, the statistical analysis conducted on geographies consisting of 43,026,964 people shows a moderate negative correlation between the proportion of Soviet Union and unemployment rate among population between the ages 16 and 19 in the United States with a correlation coefficient (R) of -0.497 and weighted average of 16.8%, a difference of 72.9%.
Unemployment Among Ages 16 to 19 years Correlation Summary
| Measurement | Navajo | Soviet Union |
| Minimum | 1.9% | 2.5% |
| Maximum | 100.0% | 25.1% |
| Range | 98.1% | 22.6% |
| Mean | 40.7% | 13.5% |
| Median | 33.3% | 12.9% |
| Interquartile 25% (IQ1) | 16.2% | 9.2% |
| Interquartile 75% (IQ3) | 57.7% | 17.1% |
| Interquartile Range (IQR) | 41.5% | 7.9% |
| Standard Deviation (Sample) | 28.7% | 6.2% |
| Standard Deviation (Population) | 28.5% | 6.1% |
Similar Demographics by Unemployment Among Ages 16 to 19 years
Demographics Similar to Navajo by Unemployment Among Ages 16 to 19 years
In terms of unemployment among ages 16 to 19 years, the demographic groups most similar to Navajo are Colville (29.7%, a difference of 2.2%), Inupiat (28.1%, a difference of 3.5%), Hopi (30.7%, a difference of 5.6%), Puerto Rican (27.5%, a difference of 5.6%), and Crow (26.2%, a difference of 10.7%).
| Demographics | Rating | Rank | Unemployment Among Ages 16 to 19 years |
| Paiute | 0.0 /100 | #333 | Tragic 24.4% |
| Guyanese | 0.0 /100 | #334 | Tragic 24.8% |
| Arapaho | 0.0 /100 | #335 | Tragic 25.2% |
| Kiowa | 0.0 /100 | #336 | Tragic 25.2% |
| Immigrants | Guyana | 0.0 /100 | #337 | Tragic 25.5% |
| Immigrants | St. Vincent and the Grenadines | 0.0 /100 | #338 | Tragic 25.7% |
| Immigrants | Grenada | 0.0 /100 | #339 | Tragic 25.7% |
| Crow | 0.0 /100 | #340 | Tragic 26.2% |
| Puerto Ricans | 0.0 /100 | #341 | Tragic 27.5% |
| Inupiat | 0.0 /100 | #342 | Tragic 28.1% |
| Navajo | 0.0 /100 | #343 | Tragic 29.0% |
| Colville | 0.0 /100 | #344 | Tragic 29.7% |
| Hopi | 0.0 /100 | #345 | Tragic 30.7% |
| Yuman | 0.0 /100 | #346 | Tragic 37.4% |
| Yup'ik | 0.0 /100 | #347 | Tragic 41.0% |
Demographics Similar to Soviet Union by Unemployment Among Ages 16 to 19 years
In terms of unemployment among ages 16 to 19 years, the demographic groups most similar to Soviet Union are Immigrants from Singapore (16.8%, a difference of 0.020%), Immigrants from North America (16.8%, a difference of 0.090%), New Zealander (16.8%, a difference of 0.15%), Slovak (16.8%, a difference of 0.15%), and French Canadian (16.8%, a difference of 0.15%).
| Demographics | Rating | Rank | Unemployment Among Ages 16 to 19 years |
| Latvians | 98.5 /100 | #71 | Exceptional 16.7% |
| Immigrants | Canada | 98.5 /100 | #72 | Exceptional 16.7% |
| Lithuanians | 98.2 /100 | #73 | Exceptional 16.7% |
| Immigrants | Eastern Africa | 98.1 /100 | #74 | Exceptional 16.8% |
| New Zealanders | 98.0 /100 | #75 | Exceptional 16.8% |
| Immigrants | North America | 97.9 /100 | #76 | Exceptional 16.8% |
| Immigrants | Singapore | 97.8 /100 | #77 | Exceptional 16.8% |
| Soviet Union | 97.8 /100 | #78 | Exceptional 16.8% |
| Slovaks | 97.5 /100 | #79 | Exceptional 16.8% |
| French Canadians | 97.5 /100 | #80 | Exceptional 16.8% |
| Immigrants | Latvia | 97.5 /100 | #81 | Exceptional 16.8% |
| Whites/Caucasians | 97.5 /100 | #82 | Exceptional 16.8% |
| Ugandans | 97.4 /100 | #83 | Exceptional 16.8% |
| French | 97.4 /100 | #84 | Exceptional 16.8% |
| Immigrants | Kuwait | 97.2 /100 | #85 | Exceptional 16.8% |