Navajo vs Estonian Median Household Income
COMPARE
Navajo
Estonian
Median Household Income
Median Household Income Comparison
Navajo
Estonians
$59,159
MEDIAN HOUSEHOLD INCOME
0.0/ 100
METRIC RATING
346th/ 347
METRIC RANK
$95,930
MEDIAN HOUSEHOLD INCOME
99.9/ 100
METRIC RATING
51st/ 347
METRIC RANK
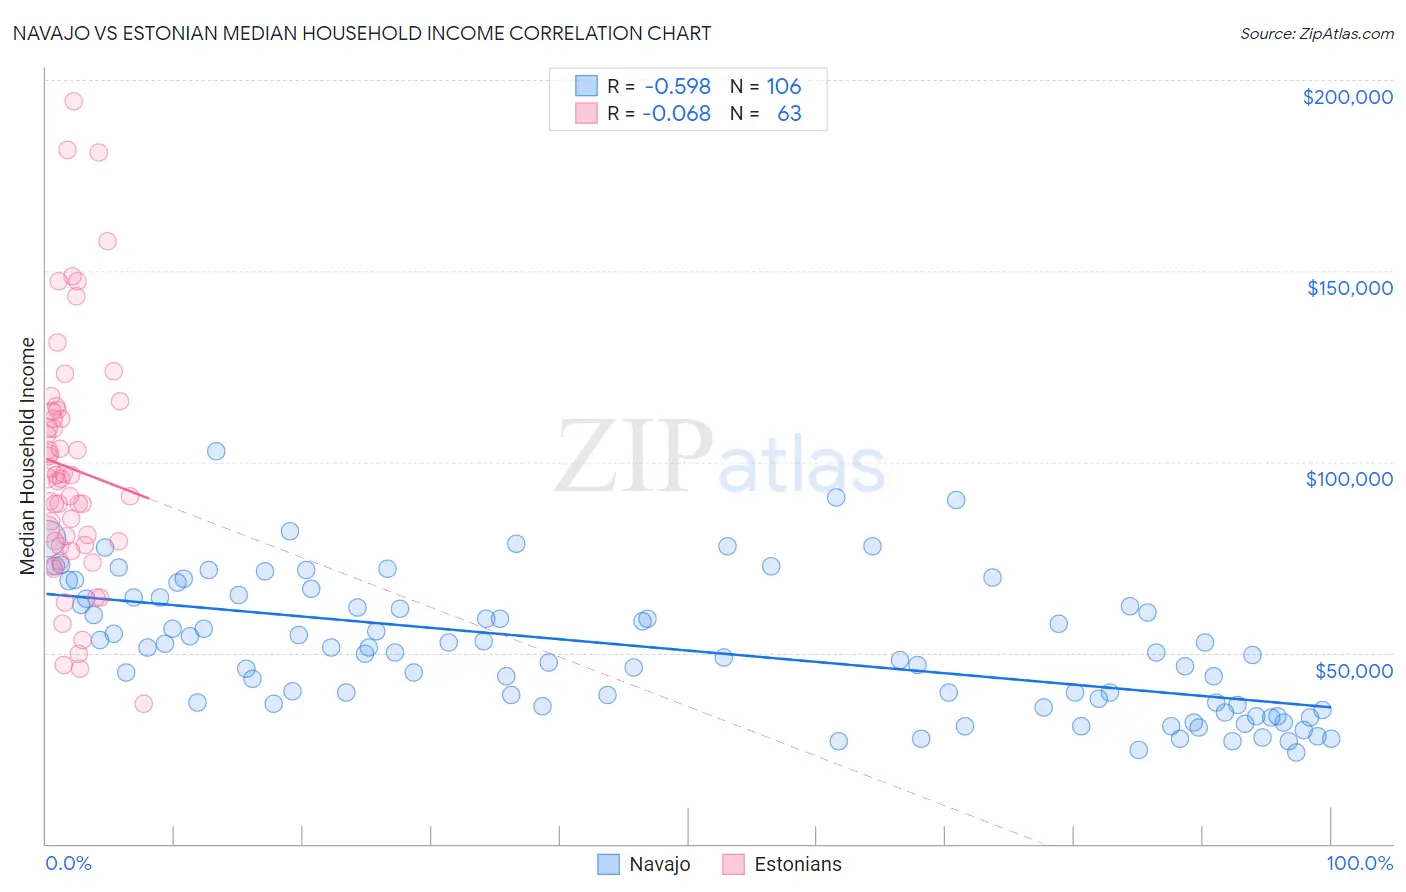
Navajo vs Estonian Median Household Income Correlation Chart
The statistical analysis conducted on geographies consisting of 224,715,573 people shows a substantial negative correlation between the proportion of Navajo and median household income in the United States with a correlation coefficient (R) of -0.598 and weighted average of $59,159. Similarly, the statistical analysis conducted on geographies consisting of 123,471,102 people shows a slight negative correlation between the proportion of Estonians and median household income in the United States with a correlation coefficient (R) of -0.068 and weighted average of $95,930, a difference of 62.2%.
Median Household Income Correlation Summary
| Measurement | Navajo | Estonian |
| Minimum | $24,004 | $36,563 |
| Maximum | $102,885 | $194,375 |
| Range | $78,881 | $157,812 |
| Mean | $51,106 | $98,343 |
| Median | $50,167 | $95,522 |
| Interquartile 25% (IQ1) | $36,185 | $78,091 |
| Interquartile 75% (IQ3) | $64,286 | $113,403 |
| Interquartile Range (IQR) | $28,101 | $35,312 |
| Standard Deviation (Sample) | $17,310 | $32,504 |
| Standard Deviation (Population) | $17,228 | $32,245 |
Similar Demographics by Median Household Income
Demographics Similar to Navajo by Median Household Income
In terms of median household income, the demographic groups most similar to Navajo are Puerto Rican ($59,197, a difference of 0.060%), Tohono O'odham ($61,663, a difference of 4.2%), Houma ($62,575, a difference of 5.8%), Pima ($63,262, a difference of 6.9%), and Crow ($63,681, a difference of 7.6%).
| Demographics | Rating | Rank | Median Household Income |
| Creek | 0.0 /100 | #333 | Tragic $67,715 |
| Blacks/African Americans | 0.0 /100 | #334 | Tragic $67,573 |
| Cheyenne | 0.0 /100 | #335 | Tragic $66,974 |
| Immigrants | Congo | 0.0 /100 | #336 | Tragic $66,768 |
| Kiowa | 0.0 /100 | #337 | Tragic $65,914 |
| Immigrants | Yemen | 0.0 /100 | #338 | Tragic $65,194 |
| Hopi | 0.0 /100 | #339 | Tragic $65,043 |
| Pueblo | 0.0 /100 | #340 | Tragic $64,692 |
| Crow | 0.0 /100 | #341 | Tragic $63,681 |
| Pima | 0.0 /100 | #342 | Tragic $63,262 |
| Houma | 0.0 /100 | #343 | Tragic $62,575 |
| Tohono O'odham | 0.0 /100 | #344 | Tragic $61,663 |
| Puerto Ricans | 0.0 /100 | #345 | Tragic $59,197 |
| Navajo | 0.0 /100 | #346 | Tragic $59,159 |
| Lumbee | 0.0 /100 | #347 | Tragic $54,644 |
Demographics Similar to Estonians by Median Household Income
In terms of median household income, the demographic groups most similar to Estonians are Immigrants from South Africa ($95,800, a difference of 0.14%), Paraguayan ($95,737, a difference of 0.20%), Egyptian ($95,673, a difference of 0.27%), Immigrants from Malaysia ($96,292, a difference of 0.38%), and Bulgarian ($96,290, a difference of 0.38%).
| Demographics | Rating | Rank | Median Household Income |
| Immigrants | Greece | 99.9 /100 | #44 | Exceptional $96,675 |
| Israelis | 99.9 /100 | #45 | Exceptional $96,552 |
| Australians | 99.9 /100 | #46 | Exceptional $96,490 |
| Immigrants | Russia | 99.9 /100 | #47 | Exceptional $96,378 |
| Cambodians | 99.9 /100 | #48 | Exceptional $96,324 |
| Immigrants | Malaysia | 99.9 /100 | #49 | Exceptional $96,292 |
| Bulgarians | 99.9 /100 | #50 | Exceptional $96,290 |
| Estonians | 99.9 /100 | #51 | Exceptional $95,930 |
| Immigrants | South Africa | 99.9 /100 | #52 | Exceptional $95,800 |
| Paraguayans | 99.9 /100 | #53 | Exceptional $95,737 |
| Egyptians | 99.9 /100 | #54 | Exceptional $95,673 |
| Immigrants | Czechoslovakia | 99.9 /100 | #55 | Exceptional $95,319 |
| Immigrants | Austria | 99.9 /100 | #56 | Exceptional $95,277 |
| New Zealanders | 99.8 /100 | #57 | Exceptional $95,146 |
| Soviet Union | 99.8 /100 | #58 | Exceptional $95,098 |