Navajo vs Immigrants from Bulgaria Median Household Income
COMPARE
Navajo
Immigrants from Bulgaria
Median Household Income
Median Household Income Comparison
Navajo
Immigrants from Bulgaria
$59,159
MEDIAN HOUSEHOLD INCOME
0.0/ 100
METRIC RATING
346th/ 347
METRIC RANK
$93,148
MEDIAN HOUSEHOLD INCOME
99.4/ 100
METRIC RATING
78th/ 347
METRIC RANK
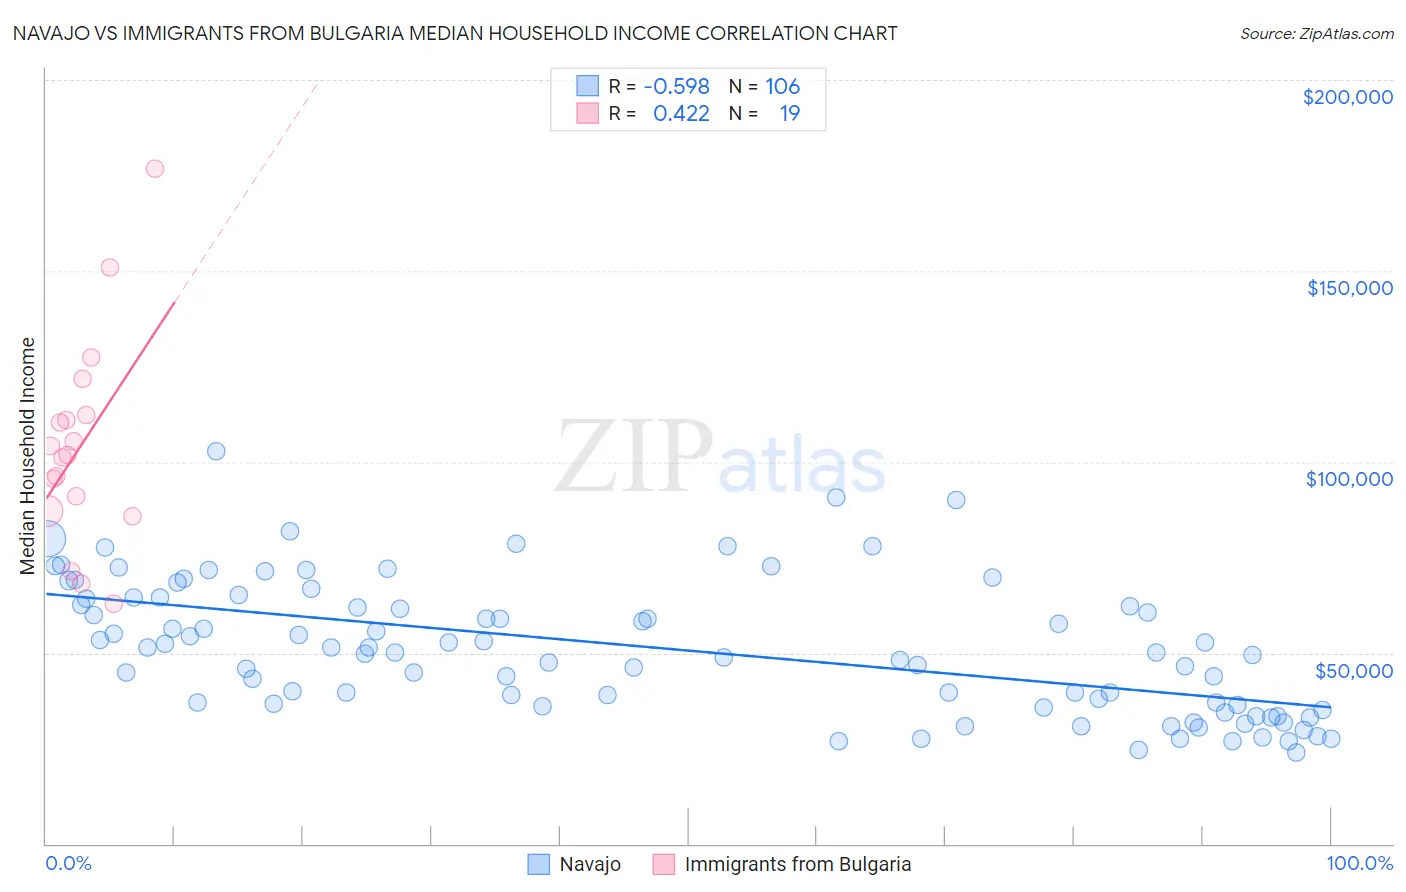
Navajo vs Immigrants from Bulgaria Median Household Income Correlation Chart
The statistical analysis conducted on geographies consisting of 224,715,573 people shows a substantial negative correlation between the proportion of Navajo and median household income in the United States with a correlation coefficient (R) of -0.598 and weighted average of $59,159. Similarly, the statistical analysis conducted on geographies consisting of 172,532,880 people shows a moderate positive correlation between the proportion of Immigrants from Bulgaria and median household income in the United States with a correlation coefficient (R) of 0.422 and weighted average of $93,148, a difference of 57.5%.
Median Household Income Correlation Summary
| Measurement | Navajo | Immigrants from Bulgaria |
| Minimum | $24,004 | $62,888 |
| Maximum | $102,885 | $176,736 |
| Range | $78,881 | $113,848 |
| Mean | $51,106 | $104,276 |
| Median | $50,167 | $101,764 |
| Interquartile 25% (IQ1) | $36,185 | $87,129 |
| Interquartile 75% (IQ3) | $64,286 | $112,416 |
| Interquartile Range (IQR) | $28,101 | $25,288 |
| Standard Deviation (Sample) | $17,310 | $27,381 |
| Standard Deviation (Population) | $17,228 | $26,651 |
Similar Demographics by Median Household Income
Demographics Similar to Navajo by Median Household Income
In terms of median household income, the demographic groups most similar to Navajo are Puerto Rican ($59,197, a difference of 0.060%), Tohono O'odham ($61,663, a difference of 4.2%), Houma ($62,575, a difference of 5.8%), Pima ($63,262, a difference of 6.9%), and Crow ($63,681, a difference of 7.6%).
| Demographics | Rating | Rank | Median Household Income |
| Creek | 0.0 /100 | #333 | Tragic $67,715 |
| Blacks/African Americans | 0.0 /100 | #334 | Tragic $67,573 |
| Cheyenne | 0.0 /100 | #335 | Tragic $66,974 |
| Immigrants | Congo | 0.0 /100 | #336 | Tragic $66,768 |
| Kiowa | 0.0 /100 | #337 | Tragic $65,914 |
| Immigrants | Yemen | 0.0 /100 | #338 | Tragic $65,194 |
| Hopi | 0.0 /100 | #339 | Tragic $65,043 |
| Pueblo | 0.0 /100 | #340 | Tragic $64,692 |
| Crow | 0.0 /100 | #341 | Tragic $63,681 |
| Pima | 0.0 /100 | #342 | Tragic $63,262 |
| Houma | 0.0 /100 | #343 | Tragic $62,575 |
| Tohono O'odham | 0.0 /100 | #344 | Tragic $61,663 |
| Puerto Ricans | 0.0 /100 | #345 | Tragic $59,197 |
| Navajo | 0.0 /100 | #346 | Tragic $59,159 |
| Lumbee | 0.0 /100 | #347 | Tragic $54,644 |
Demographics Similar to Immigrants from Bulgaria by Median Household Income
In terms of median household income, the demographic groups most similar to Immigrants from Bulgaria are Sri Lankan ($93,093, a difference of 0.060%), Tongan ($93,076, a difference of 0.080%), Immigrants from Eastern Europe ($93,051, a difference of 0.10%), Immigrants from Afghanistan ($93,375, a difference of 0.24%), and South African ($93,379, a difference of 0.25%).
| Demographics | Rating | Rank | Median Household Income |
| Immigrants | Philippines | 99.6 /100 | #71 | Exceptional $93,899 |
| Lithuanians | 99.6 /100 | #72 | Exceptional $93,852 |
| Immigrants | Egypt | 99.6 /100 | #73 | Exceptional $93,700 |
| Immigrants | Latvia | 99.6 /100 | #74 | Exceptional $93,602 |
| Immigrants | Italy | 99.5 /100 | #75 | Exceptional $93,465 |
| South Africans | 99.5 /100 | #76 | Exceptional $93,379 |
| Immigrants | Afghanistan | 99.5 /100 | #77 | Exceptional $93,375 |
| Immigrants | Bulgaria | 99.4 /100 | #78 | Exceptional $93,148 |
| Sri Lankans | 99.4 /100 | #79 | Exceptional $93,093 |
| Tongans | 99.4 /100 | #80 | Exceptional $93,076 |
| Immigrants | Eastern Europe | 99.4 /100 | #81 | Exceptional $93,051 |
| Immigrants | Spain | 99.3 /100 | #82 | Exceptional $92,732 |
| Italians | 99.1 /100 | #83 | Exceptional $92,475 |
| Immigrants | Argentina | 99.1 /100 | #84 | Exceptional $92,417 |
| Immigrants | Croatia | 99.0 /100 | #85 | Exceptional $92,225 |