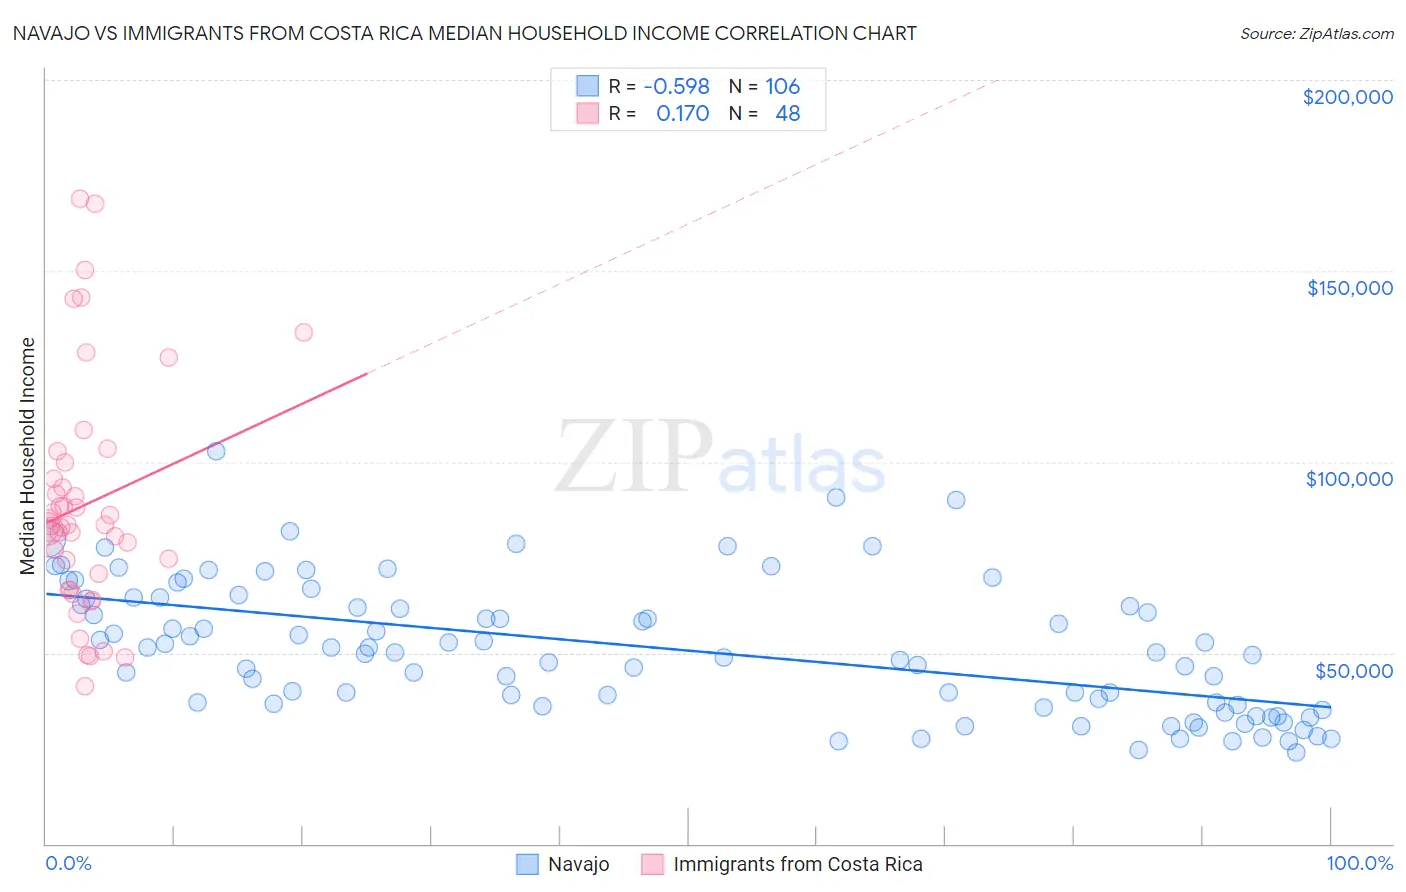
Navajo vs Immigrants from Costa Rica Median Household Income
COMPARE
Navajo
Immigrants from Costa Rica
Median Household Income
Median Household Income Comparison
Navajo
Immigrants from Costa Rica
$59,159
MEDIAN HOUSEHOLD INCOME
0.0/ 100
METRIC RATING
346th/ 347
METRIC RANK
$85,054
MEDIAN HOUSEHOLD INCOME
49.2/ 100
METRIC RATING
175th/ 347
METRIC RANK
Navajo vs Immigrants from Costa Rica Median Household Income Correlation Chart
The statistical analysis conducted on geographies consisting of 224,715,573 people shows a substantial negative correlation between the proportion of Navajo and median household income in the United States with a correlation coefficient (R) of -0.598 and weighted average of $59,159. Similarly, the statistical analysis conducted on geographies consisting of 204,222,655 people shows a poor positive correlation between the proportion of Immigrants from Costa Rica and median household income in the United States with a correlation coefficient (R) of 0.170 and weighted average of $85,054, a difference of 43.8%.
Median Household Income Correlation Summary
| Measurement | Navajo | Immigrants from Costa Rica |
| Minimum | $24,004 | $41,250 |
| Maximum | $102,885 | $168,837 |
| Range | $78,881 | $127,587 |
| Mean | $51,106 | $88,867 |
| Median | $50,167 | $83,191 |
| Interquartile 25% (IQ1) | $36,185 | $68,706 |
| Interquartile 75% (IQ3) | $64,286 | $97,715 |
| Interquartile Range (IQR) | $28,101 | $29,008 |
| Standard Deviation (Sample) | $17,310 | $30,266 |
| Standard Deviation (Population) | $17,228 | $29,949 |
Similar Demographics by Median Household Income
Demographics Similar to Navajo by Median Household Income
In terms of median household income, the demographic groups most similar to Navajo are Puerto Rican ($59,197, a difference of 0.060%), Tohono O'odham ($61,663, a difference of 4.2%), Houma ($62,575, a difference of 5.8%), Pima ($63,262, a difference of 6.9%), and Crow ($63,681, a difference of 7.6%).
| Demographics | Rating | Rank | Median Household Income |
| Creek | 0.0 /100 | #333 | Tragic $67,715 |
| Blacks/African Americans | 0.0 /100 | #334 | Tragic $67,573 |
| Cheyenne | 0.0 /100 | #335 | Tragic $66,974 |
| Immigrants | Congo | 0.0 /100 | #336 | Tragic $66,768 |
| Kiowa | 0.0 /100 | #337 | Tragic $65,914 |
| Immigrants | Yemen | 0.0 /100 | #338 | Tragic $65,194 |
| Hopi | 0.0 /100 | #339 | Tragic $65,043 |
| Pueblo | 0.0 /100 | #340 | Tragic $64,692 |
| Crow | 0.0 /100 | #341 | Tragic $63,681 |
| Pima | 0.0 /100 | #342 | Tragic $63,262 |
| Houma | 0.0 /100 | #343 | Tragic $62,575 |
| Tohono O'odham | 0.0 /100 | #344 | Tragic $61,663 |
| Puerto Ricans | 0.0 /100 | #345 | Tragic $59,197 |
| Navajo | 0.0 /100 | #346 | Tragic $59,159 |
| Lumbee | 0.0 /100 | #347 | Tragic $54,644 |
Demographics Similar to Immigrants from Costa Rica by Median Household Income
In terms of median household income, the demographic groups most similar to Immigrants from Costa Rica are Alsatian ($85,053, a difference of 0.0%), Immigrants from Eritrea ($85,025, a difference of 0.030%), Scottish ($85,101, a difference of 0.050%), Czechoslovakian ($84,965, a difference of 0.10%), and English ($84,915, a difference of 0.16%).
| Demographics | Rating | Rank | Median Household Income |
| Icelanders | 61.0 /100 | #168 | Good $85,797 |
| Colombians | 59.7 /100 | #169 | Average $85,716 |
| Swiss | 59.2 /100 | #170 | Average $85,681 |
| Immigrants | South America | 58.1 /100 | #171 | Average $85,611 |
| Slovenes | 57.4 /100 | #172 | Average $85,562 |
| Immigrants | Cameroon | 53.4 /100 | #173 | Average $85,314 |
| Scottish | 50.0 /100 | #174 | Average $85,101 |
| Immigrants | Costa Rica | 49.2 /100 | #175 | Average $85,054 |
| Alsatians | 49.2 /100 | #176 | Average $85,053 |
| Immigrants | Eritrea | 48.8 /100 | #177 | Average $85,025 |
| Czechoslovakians | 47.8 /100 | #178 | Average $84,965 |
| English | 47.0 /100 | #179 | Average $84,915 |
| Immigrants | Portugal | 44.2 /100 | #180 | Average $84,740 |
| Hawaiians | 44.1 /100 | #181 | Average $84,729 |
| Uruguayans | 43.5 /100 | #182 | Average $84,691 |