Arapaho vs Vietnamese Householder Income Under 25 years
COMPARE
Arapaho
Vietnamese
Householder Income Under 25 years
Householder Income Under 25 years Comparison
Arapaho
Vietnamese
$44,003
HOUSEHOLDER INCOME UNDER 25 YEARS
0.0/ 100
METRIC RATING
342nd/ 347
METRIC RANK
$56,127
HOUSEHOLDER INCOME UNDER 25 YEARS
100.0/ 100
METRIC RATING
31st/ 347
METRIC RANK
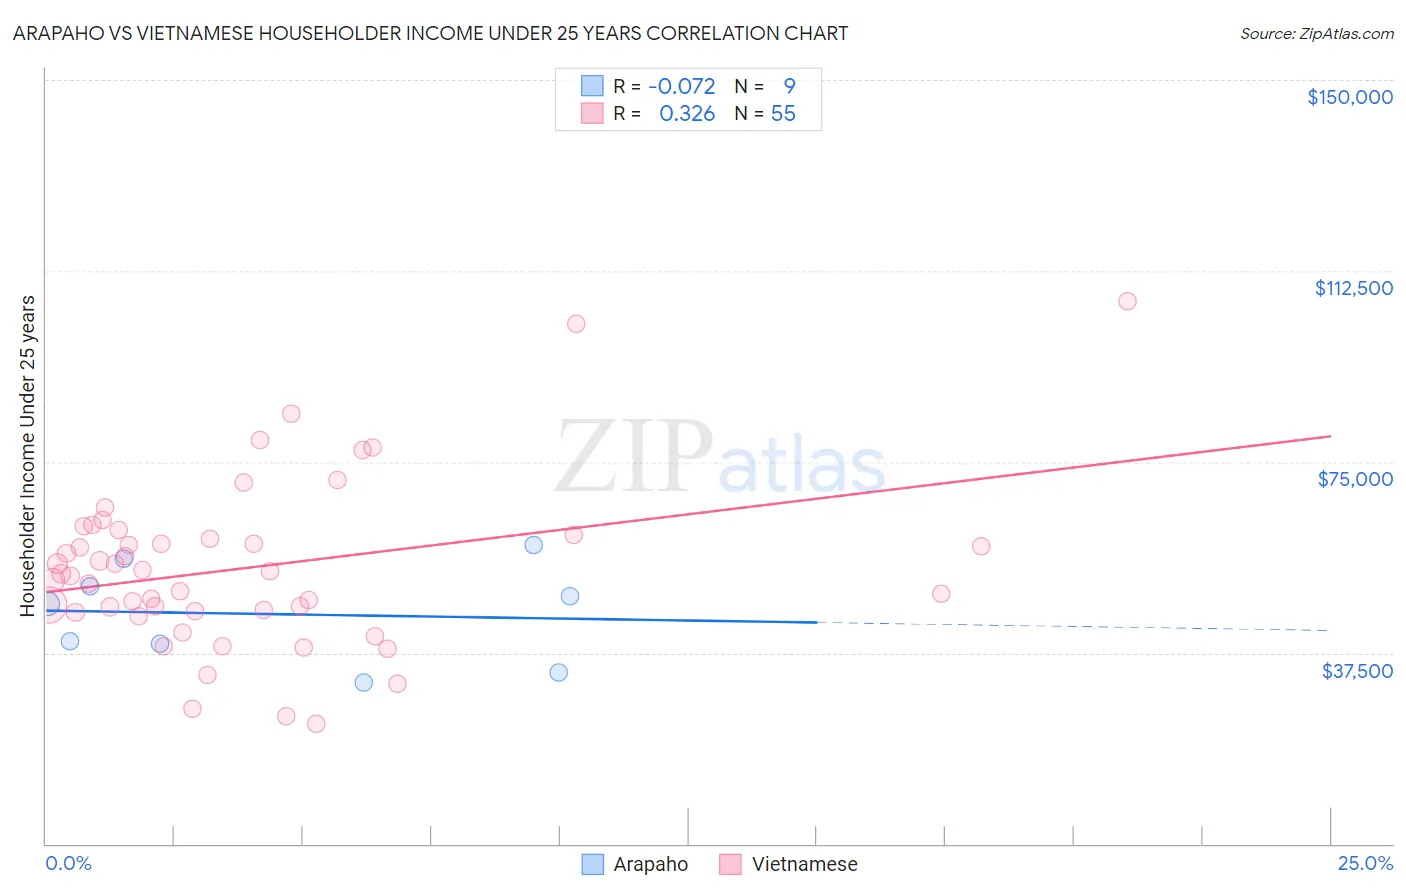
Arapaho vs Vietnamese Householder Income Under 25 years Correlation Chart
The statistical analysis conducted on geographies consisting of 28,310,734 people shows a slight negative correlation between the proportion of Arapaho and household income with householder under the age of 25 in the United States with a correlation coefficient (R) of -0.072 and weighted average of $44,003. Similarly, the statistical analysis conducted on geographies consisting of 155,350,861 people shows a mild positive correlation between the proportion of Vietnamese and household income with householder under the age of 25 in the United States with a correlation coefficient (R) of 0.326 and weighted average of $56,127, a difference of 27.6%.
Householder Income Under 25 years Correlation Summary
| Measurement | Arapaho | Vietnamese |
| Minimum | $31,607 | $23,560 |
| Maximum | $58,750 | $106,635 |
| Range | $27,143 | $83,075 |
| Mean | $45,071 | $54,213 |
| Median | $47,132 | $52,933 |
| Interquartile 25% (IQ1) | $36,562 | $45,658 |
| Interquartile 75% (IQ3) | $53,264 | $60,617 |
| Interquartile Range (IQR) | $16,702 | $14,959 |
| Standard Deviation (Sample) | $9,498 | $16,342 |
| Standard Deviation (Population) | $8,955 | $16,193 |
Similar Demographics by Householder Income Under 25 years
Demographics Similar to Arapaho by Householder Income Under 25 years
In terms of householder income under 25 years, the demographic groups most similar to Arapaho are Houma ($44,356, a difference of 0.80%), Black/African American ($44,381, a difference of 0.86%), Immigrants from Yemen ($43,591, a difference of 0.95%), Kiowa ($44,733, a difference of 1.7%), and Immigrants from Congo ($43,266, a difference of 1.7%).
| Demographics | Rating | Rank | Householder Income Under 25 years |
| Creek | 0.0 /100 | #333 | Tragic $45,371 |
| Cajuns | 0.0 /100 | #334 | Tragic $45,338 |
| Cheyenne | 0.0 /100 | #335 | Tragic $45,275 |
| Tohono O'odham | 0.0 /100 | #336 | Tragic $45,248 |
| Pueblo | 0.0 /100 | #337 | Tragic $45,018 |
| Chickasaw | 0.0 /100 | #338 | Tragic $44,763 |
| Kiowa | 0.0 /100 | #339 | Tragic $44,733 |
| Blacks/African Americans | 0.0 /100 | #340 | Tragic $44,381 |
| Houma | 0.0 /100 | #341 | Tragic $44,356 |
| Arapaho | 0.0 /100 | #342 | Tragic $44,003 |
| Immigrants | Yemen | 0.0 /100 | #343 | Tragic $43,591 |
| Immigrants | Congo | 0.0 /100 | #344 | Tragic $43,266 |
| Navajo | 0.0 /100 | #345 | Tragic $42,380 |
| Puerto Ricans | 0.0 /100 | #346 | Tragic $39,726 |
| Lumbee | 0.0 /100 | #347 | Tragic $34,584 |
Demographics Similar to Vietnamese by Householder Income Under 25 years
In terms of householder income under 25 years, the demographic groups most similar to Vietnamese are Immigrants from Moldova ($56,168, a difference of 0.070%), Peruvian ($56,052, a difference of 0.13%), Inupiat ($55,935, a difference of 0.34%), Immigrants from Japan ($55,932, a difference of 0.35%), and Tlingit-Haida ($55,914, a difference of 0.38%).
| Demographics | Rating | Rank | Householder Income Under 25 years |
| Immigrants | Singapore | 100.0 /100 | #24 | Exceptional $56,835 |
| Immigrants | Pakistan | 100.0 /100 | #25 | Exceptional $56,789 |
| Immigrants | Australia | 100.0 /100 | #26 | Exceptional $56,660 |
| Immigrants | North Macedonia | 100.0 /100 | #27 | Exceptional $56,503 |
| Immigrants | Peru | 100.0 /100 | #28 | Exceptional $56,384 |
| Immigrants | Asia | 100.0 /100 | #29 | Exceptional $56,379 |
| Immigrants | Moldova | 100.0 /100 | #30 | Exceptional $56,168 |
| Vietnamese | 100.0 /100 | #31 | Exceptional $56,127 |
| Peruvians | 100.0 /100 | #32 | Exceptional $56,052 |
| Inupiat | 100.0 /100 | #33 | Exceptional $55,935 |
| Immigrants | Japan | 100.0 /100 | #34 | Exceptional $55,932 |
| Tlingit-Haida | 100.0 /100 | #35 | Exceptional $55,914 |
| Immigrants | Israel | 100.0 /100 | #36 | Exceptional $55,913 |
| Immigrants | Russia | 100.0 /100 | #37 | Exceptional $55,891 |
| Immigrants | Iran | 100.0 /100 | #38 | Exceptional $55,880 |