Yup'ik vs Vietnamese Householder Income Under 25 years
COMPARE
Yup'ik
Vietnamese
Householder Income Under 25 years
Householder Income Under 25 years Comparison
Yup'ik
Vietnamese
$54,732
HOUSEHOLDER INCOME UNDER 25 YEARS
99.8/ 100
METRIC RATING
65th/ 347
METRIC RANK
$56,127
HOUSEHOLDER INCOME UNDER 25 YEARS
100.0/ 100
METRIC RATING
31st/ 347
METRIC RANK
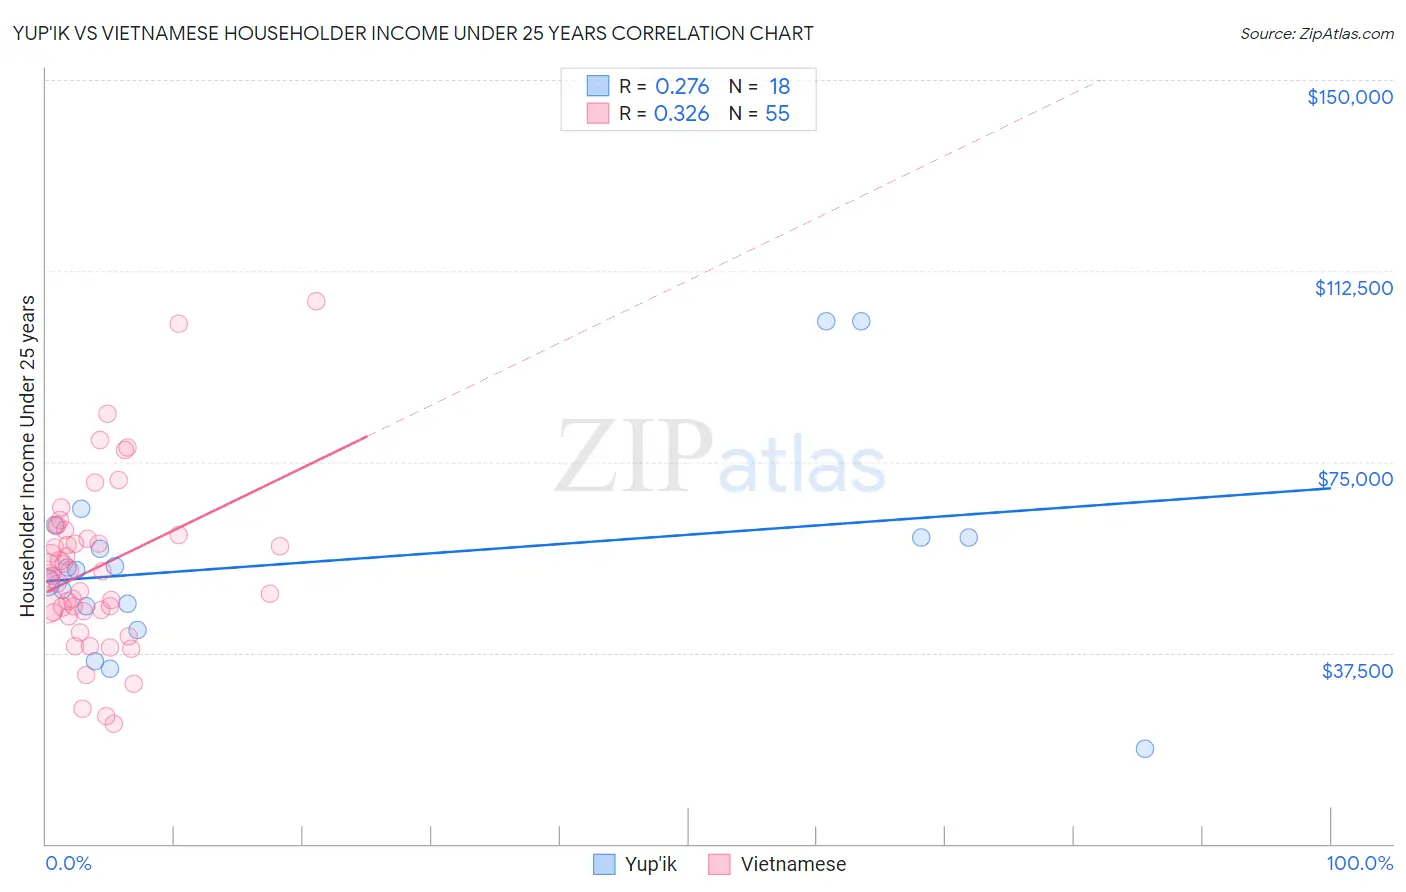
Yup'ik vs Vietnamese Householder Income Under 25 years Correlation Chart
The statistical analysis conducted on geographies consisting of 38,257,105 people shows a weak positive correlation between the proportion of Yup'ik and household income with householder under the age of 25 in the United States with a correlation coefficient (R) of 0.276 and weighted average of $54,732. Similarly, the statistical analysis conducted on geographies consisting of 155,350,861 people shows a mild positive correlation between the proportion of Vietnamese and household income with householder under the age of 25 in the United States with a correlation coefficient (R) of 0.326 and weighted average of $56,127, a difference of 2.5%.
Householder Income Under 25 years Correlation Summary
| Measurement | Yup'ik | Vietnamese |
| Minimum | $18,750 | $23,560 |
| Maximum | $102,500 | $106,635 |
| Range | $83,750 | $83,075 |
| Mean | $55,559 | $54,213 |
| Median | $54,036 | $52,933 |
| Interquartile 25% (IQ1) | $46,548 | $45,658 |
| Interquartile 75% (IQ3) | $60,268 | $60,617 |
| Interquartile Range (IQR) | $13,720 | $14,959 |
| Standard Deviation (Sample) | $20,577 | $16,342 |
| Standard Deviation (Population) | $19,998 | $16,193 |
Similar Demographics by Householder Income Under 25 years
Demographics Similar to Yup'ik by Householder Income Under 25 years
In terms of householder income under 25 years, the demographic groups most similar to Yup'ik are Immigrants from Bangladesh ($54,714, a difference of 0.030%), Okinawan ($54,701, a difference of 0.060%), Burmese ($54,800, a difference of 0.12%), Tsimshian ($54,649, a difference of 0.15%), and Immigrants from Belgium ($54,830, a difference of 0.18%).
| Demographics | Rating | Rank | Householder Income Under 25 years |
| Guyanese | 99.9 /100 | #58 | Exceptional $55,210 |
| Native Hawaiians | 99.9 /100 | #59 | Exceptional $55,158 |
| Immigrants | Lithuania | 99.9 /100 | #60 | Exceptional $55,028 |
| Immigrants | Europe | 99.9 /100 | #61 | Exceptional $55,022 |
| Immigrants | Uzbekistan | 99.8 /100 | #62 | Exceptional $54,846 |
| Immigrants | Belgium | 99.8 /100 | #63 | Exceptional $54,830 |
| Burmese | 99.8 /100 | #64 | Exceptional $54,800 |
| Yup'ik | 99.8 /100 | #65 | Exceptional $54,732 |
| Immigrants | Bangladesh | 99.8 /100 | #66 | Exceptional $54,714 |
| Okinawans | 99.8 /100 | #67 | Exceptional $54,701 |
| Tsimshian | 99.8 /100 | #68 | Exceptional $54,649 |
| Samoans | 99.7 /100 | #69 | Exceptional $54,610 |
| Immigrants | El Salvador | 99.7 /100 | #70 | Exceptional $54,599 |
| Immigrants | Morocco | 99.7 /100 | #71 | Exceptional $54,593 |
| Immigrants | Northern Europe | 99.7 /100 | #72 | Exceptional $54,571 |
Demographics Similar to Vietnamese by Householder Income Under 25 years
In terms of householder income under 25 years, the demographic groups most similar to Vietnamese are Immigrants from Moldova ($56,168, a difference of 0.070%), Peruvian ($56,052, a difference of 0.13%), Inupiat ($55,935, a difference of 0.34%), Immigrants from Japan ($55,932, a difference of 0.35%), and Tlingit-Haida ($55,914, a difference of 0.38%).
| Demographics | Rating | Rank | Householder Income Under 25 years |
| Immigrants | Singapore | 100.0 /100 | #24 | Exceptional $56,835 |
| Immigrants | Pakistan | 100.0 /100 | #25 | Exceptional $56,789 |
| Immigrants | Australia | 100.0 /100 | #26 | Exceptional $56,660 |
| Immigrants | North Macedonia | 100.0 /100 | #27 | Exceptional $56,503 |
| Immigrants | Peru | 100.0 /100 | #28 | Exceptional $56,384 |
| Immigrants | Asia | 100.0 /100 | #29 | Exceptional $56,379 |
| Immigrants | Moldova | 100.0 /100 | #30 | Exceptional $56,168 |
| Vietnamese | 100.0 /100 | #31 | Exceptional $56,127 |
| Peruvians | 100.0 /100 | #32 | Exceptional $56,052 |
| Inupiat | 100.0 /100 | #33 | Exceptional $55,935 |
| Immigrants | Japan | 100.0 /100 | #34 | Exceptional $55,932 |
| Tlingit-Haida | 100.0 /100 | #35 | Exceptional $55,914 |
| Immigrants | Israel | 100.0 /100 | #36 | Exceptional $55,913 |
| Immigrants | Russia | 100.0 /100 | #37 | Exceptional $55,891 |
| Immigrants | Iran | 100.0 /100 | #38 | Exceptional $55,880 |