Puget Sound Salish vs Vietnamese Householder Income Under 25 years
COMPARE
Puget Sound Salish
Vietnamese
Householder Income Under 25 years
Householder Income Under 25 years Comparison
Puget Sound Salish
Vietnamese
$55,543
HOUSEHOLDER INCOME UNDER 25 YEARS
100.0/ 100
METRIC RATING
50th/ 347
METRIC RANK
$56,127
HOUSEHOLDER INCOME UNDER 25 YEARS
100.0/ 100
METRIC RATING
31st/ 347
METRIC RANK
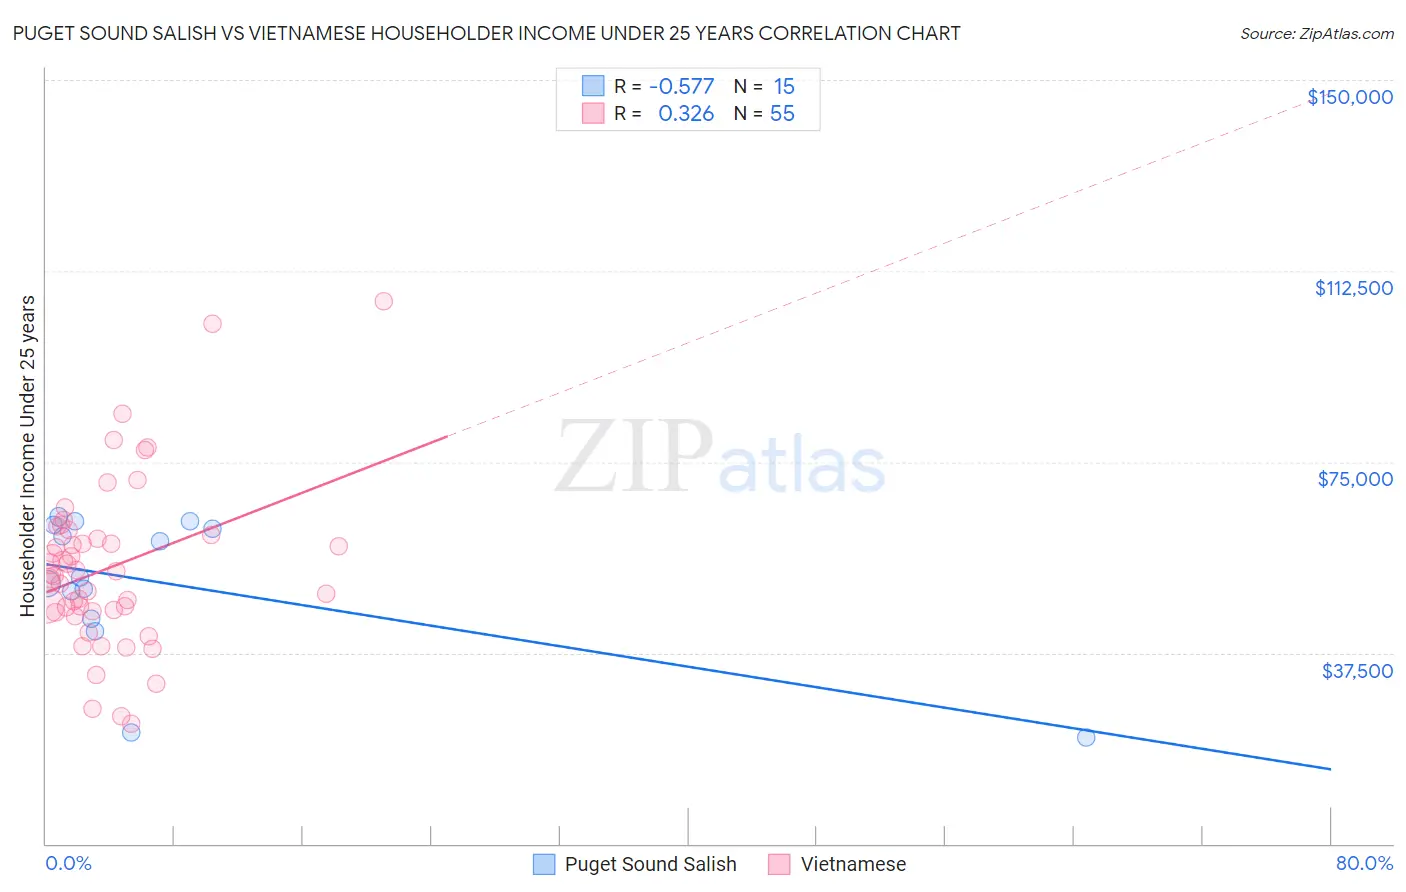
Puget Sound Salish vs Vietnamese Householder Income Under 25 years Correlation Chart
The statistical analysis conducted on geographies consisting of 43,619,014 people shows a substantial negative correlation between the proportion of Puget Sound Salish and household income with householder under the age of 25 in the United States with a correlation coefficient (R) of -0.577 and weighted average of $55,543. Similarly, the statistical analysis conducted on geographies consisting of 155,350,861 people shows a mild positive correlation between the proportion of Vietnamese and household income with householder under the age of 25 in the United States with a correlation coefficient (R) of 0.326 and weighted average of $56,127, a difference of 1.1%.
Householder Income Under 25 years Correlation Summary
| Measurement | Puget Sound Salish | Vietnamese |
| Minimum | $20,833 | $23,560 |
| Maximum | $64,208 | $106,635 |
| Range | $43,375 | $83,075 |
| Mean | $51,133 | $54,213 |
| Median | $52,249 | $52,933 |
| Interquartile 25% (IQ1) | $44,250 | $45,658 |
| Interquartile 75% (IQ3) | $62,601 | $60,617 |
| Interquartile Range (IQR) | $18,351 | $14,959 |
| Standard Deviation (Sample) | $14,105 | $16,342 |
| Standard Deviation (Population) | $13,627 | $16,193 |
Demographics Similar to Puget Sound Salish and Vietnamese by Householder Income Under 25 years
In terms of householder income under 25 years, the demographic groups most similar to Puget Sound Salish are Iranian ($55,548, a difference of 0.010%), Immigrants from Vietnam ($55,562, a difference of 0.030%), Spanish American Indian ($55,573, a difference of 0.050%), Immigrants from Eastern Europe ($55,572, a difference of 0.050%), and Cambodian ($55,571, a difference of 0.050%). Similarly, the demographic groups most similar to Vietnamese are Immigrants from Moldova ($56,168, a difference of 0.070%), Peruvian ($56,052, a difference of 0.13%), Inupiat ($55,935, a difference of 0.34%), Immigrants from Japan ($55,932, a difference of 0.35%), and Tlingit-Haida ($55,914, a difference of 0.38%).
| Demographics | Rating | Rank | Householder Income Under 25 years |
| Immigrants | Moldova | 100.0 /100 | #30 | Exceptional $56,168 |
| Vietnamese | 100.0 /100 | #31 | Exceptional $56,127 |
| Peruvians | 100.0 /100 | #32 | Exceptional $56,052 |
| Inupiat | 100.0 /100 | #33 | Exceptional $55,935 |
| Immigrants | Japan | 100.0 /100 | #34 | Exceptional $55,932 |
| Tlingit-Haida | 100.0 /100 | #35 | Exceptional $55,914 |
| Immigrants | Israel | 100.0 /100 | #36 | Exceptional $55,913 |
| Immigrants | Russia | 100.0 /100 | #37 | Exceptional $55,891 |
| Immigrants | Iran | 100.0 /100 | #38 | Exceptional $55,880 |
| Immigrants | Belarus | 100.0 /100 | #39 | Exceptional $55,743 |
| Immigrants | Greece | 100.0 /100 | #40 | Exceptional $55,727 |
| Immigrants | Guyana | 100.0 /100 | #41 | Exceptional $55,726 |
| Immigrants | Korea | 100.0 /100 | #42 | Exceptional $55,716 |
| Immigrants | South Eastern Asia | 100.0 /100 | #43 | Exceptional $55,714 |
| Paraguayans | 100.0 /100 | #44 | Exceptional $55,614 |
| Spanish American Indians | 100.0 /100 | #45 | Exceptional $55,573 |
| Immigrants | Eastern Europe | 100.0 /100 | #46 | Exceptional $55,572 |
| Cambodians | 100.0 /100 | #47 | Exceptional $55,571 |
| Immigrants | Vietnam | 100.0 /100 | #48 | Exceptional $55,562 |
| Iranians | 100.0 /100 | #49 | Exceptional $55,548 |
| Puget Sound Salish | 100.0 /100 | #50 | Exceptional $55,543 |