Immigrants from Nepal vs South American Median Male Earnings
COMPARE
Immigrants from Nepal
South American
Median Male Earnings
Median Male Earnings Comparison
Immigrants from Nepal
South Americans
$55,615
MEDIAN MALE EARNINGS
75.0/ 100
METRIC RATING
153rd/ 347
METRIC RANK
$54,492
MEDIAN MALE EARNINGS
50.0/ 100
METRIC RATING
174th/ 347
METRIC RANK
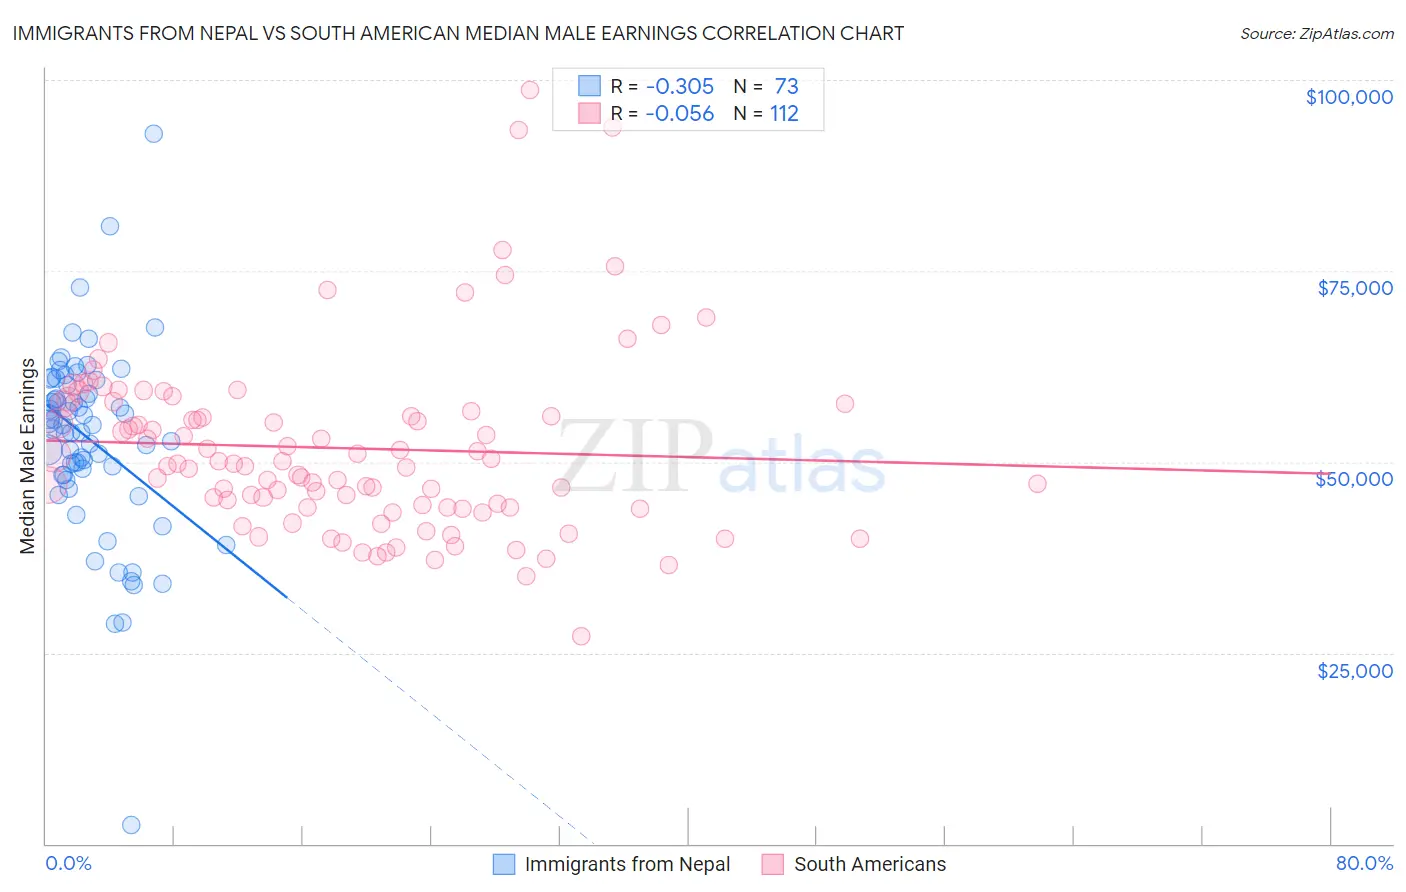
Immigrants from Nepal vs South American Median Male Earnings Correlation Chart
The statistical analysis conducted on geographies consisting of 186,778,283 people shows a mild negative correlation between the proportion of Immigrants from Nepal and median male earnings in the United States with a correlation coefficient (R) of -0.305 and weighted average of $55,615. Similarly, the statistical analysis conducted on geographies consisting of 493,870,370 people shows a slight negative correlation between the proportion of South Americans and median male earnings in the United States with a correlation coefficient (R) of -0.056 and weighted average of $54,492, a difference of 2.1%.
Median Male Earnings Correlation Summary
| Measurement | Immigrants from Nepal | South American |
| Minimum | $2,499 | $27,125 |
| Maximum | $93,000 | $98,656 |
| Range | $90,501 | $71,531 |
| Mean | $52,957 | $51,788 |
| Median | $54,879 | $49,715 |
| Interquartile 25% (IQ1) | $48,301 | $44,028 |
| Interquartile 75% (IQ3) | $60,442 | $57,077 |
| Interquartile Range (IQR) | $12,141 | $13,050 |
| Standard Deviation (Sample) | $12,480 | $11,850 |
| Standard Deviation (Population) | $12,394 | $11,797 |
Similar Demographics by Median Male Earnings
Demographics Similar to Immigrants from Nepal by Median Male Earnings
In terms of median male earnings, the demographic groups most similar to Immigrants from Nepal are Peruvian ($55,659, a difference of 0.080%), Taiwanese ($55,556, a difference of 0.11%), Scandinavian ($55,527, a difference of 0.16%), Immigrants from Oceania ($55,712, a difference of 0.17%), and Swiss ($55,731, a difference of 0.21%).
| Demographics | Rating | Rank | Median Male Earnings |
| Immigrants | Chile | 80.7 /100 | #146 | Excellent $55,954 |
| Immigrants | Philippines | 78.4 /100 | #147 | Good $55,809 |
| Scottish | 78.2 /100 | #148 | Good $55,793 |
| English | 77.4 /100 | #149 | Good $55,747 |
| Swiss | 77.1 /100 | #150 | Good $55,731 |
| Immigrants | Oceania | 76.8 /100 | #151 | Good $55,712 |
| Peruvians | 75.8 /100 | #152 | Good $55,659 |
| Immigrants | Nepal | 75.0 /100 | #153 | Good $55,615 |
| Taiwanese | 73.9 /100 | #154 | Good $55,556 |
| Scandinavians | 73.4 /100 | #155 | Good $55,527 |
| Immigrants | Ethiopia | 71.6 /100 | #156 | Good $55,434 |
| Icelanders | 71.2 /100 | #157 | Good $55,415 |
| Czechoslovakians | 70.5 /100 | #158 | Good $55,382 |
| Alsatians | 70.5 /100 | #159 | Good $55,380 |
| Basques | 70.3 /100 | #160 | Good $55,370 |
Demographics Similar to South Americans by Median Male Earnings
In terms of median male earnings, the demographic groups most similar to South Americans are South American Indian ($54,508, a difference of 0.030%), Dutch ($54,410, a difference of 0.15%), Spaniard ($54,401, a difference of 0.17%), Welsh ($54,647, a difference of 0.28%), and Immigrants from Peru ($54,695, a difference of 0.37%).
| Demographics | Rating | Rank | Median Male Earnings |
| Immigrants | Fiji | 61.2 /100 | #167 | Good $54,958 |
| Immigrants | Vietnam | 60.2 /100 | #168 | Good $54,913 |
| French Canadians | 55.6 /100 | #169 | Average $54,722 |
| Finns | 55.6 /100 | #170 | Average $54,721 |
| Immigrants | Peru | 54.9 /100 | #171 | Average $54,695 |
| Welsh | 53.8 /100 | #172 | Average $54,647 |
| South American Indians | 50.4 /100 | #173 | Average $54,508 |
| South Americans | 50.0 /100 | #174 | Average $54,492 |
| Dutch | 48.0 /100 | #175 | Average $54,410 |
| Spaniards | 47.8 /100 | #176 | Average $54,401 |
| Costa Ricans | 44.8 /100 | #177 | Average $54,279 |
| Sierra Leoneans | 44.8 /100 | #178 | Average $54,279 |
| Celtics | 43.9 /100 | #179 | Average $54,242 |
| Iraqis | 42.5 /100 | #180 | Average $54,182 |
| Immigrants | Immigrants | 42.1 /100 | #181 | Average $54,168 |