Immigrants from Guyana vs South American Median Male Earnings
COMPARE
Immigrants from Guyana
South American
Median Male Earnings
Median Male Earnings Comparison
Immigrants from Guyana
South Americans
$50,321
MEDIAN MALE EARNINGS
1.6/ 100
METRIC RATING
248th/ 347
METRIC RANK
$54,492
MEDIAN MALE EARNINGS
50.0/ 100
METRIC RATING
174th/ 347
METRIC RANK
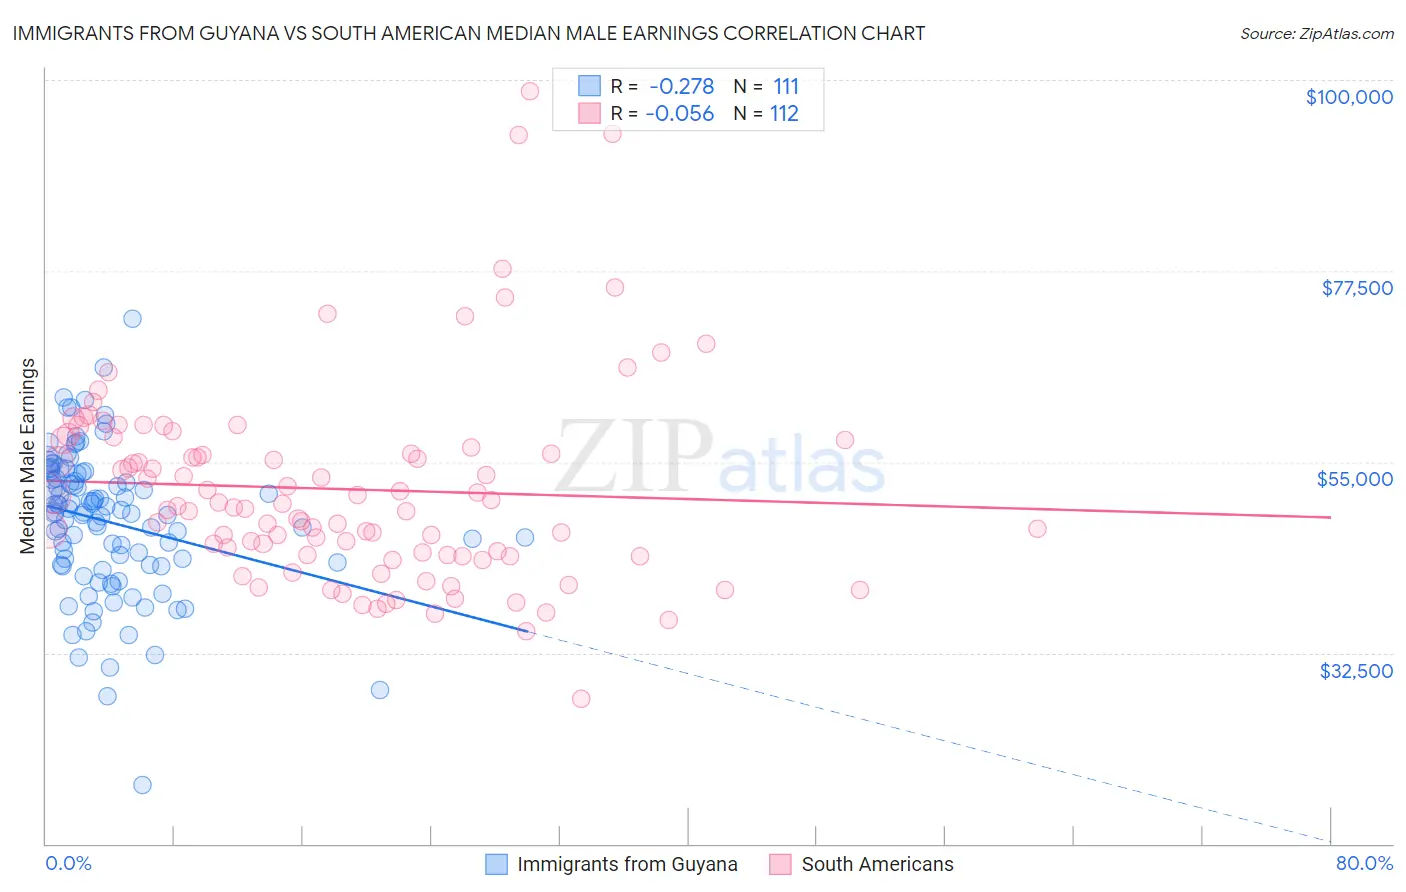
Immigrants from Guyana vs South American Median Male Earnings Correlation Chart
The statistical analysis conducted on geographies consisting of 183,717,574 people shows a weak negative correlation between the proportion of Immigrants from Guyana and median male earnings in the United States with a correlation coefficient (R) of -0.278 and weighted average of $50,321. Similarly, the statistical analysis conducted on geographies consisting of 493,870,370 people shows a slight negative correlation between the proportion of South Americans and median male earnings in the United States with a correlation coefficient (R) of -0.056 and weighted average of $54,492, a difference of 8.3%.
Median Male Earnings Correlation Summary
| Measurement | Immigrants from Guyana | South American |
| Minimum | $16,923 | $27,125 |
| Maximum | $71,805 | $98,656 |
| Range | $54,882 | $71,531 |
| Mean | $47,916 | $51,788 |
| Median | $49,022 | $49,715 |
| Interquartile 25% (IQ1) | $42,798 | $44,028 |
| Interquartile 75% (IQ3) | $53,585 | $57,077 |
| Interquartile Range (IQR) | $10,787 | $13,050 |
| Standard Deviation (Sample) | $8,575 | $11,850 |
| Standard Deviation (Population) | $8,536 | $11,797 |
Similar Demographics by Median Male Earnings
Demographics Similar to Immigrants from Guyana by Median Male Earnings
In terms of median male earnings, the demographic groups most similar to Immigrants from Guyana are Immigrants from Burma/Myanmar ($50,298, a difference of 0.050%), Osage ($50,292, a difference of 0.060%), Immigrants from Grenada ($50,279, a difference of 0.080%), Subsaharan African ($50,408, a difference of 0.17%), and Immigrants from Ecuador ($50,474, a difference of 0.30%).
| Demographics | Rating | Rank | Median Male Earnings |
| Immigrants | St. Vincent and the Grenadines | 2.3 /100 | #241 | Tragic $50,665 |
| Guyanese | 2.2 /100 | #242 | Tragic $50,613 |
| French American Indians | 2.2 /100 | #243 | Tragic $50,611 |
| Houma | 2.0 /100 | #244 | Tragic $50,547 |
| Hawaiians | 1.9 /100 | #245 | Tragic $50,488 |
| Immigrants | Ecuador | 1.9 /100 | #246 | Tragic $50,474 |
| Sub-Saharan Africans | 1.8 /100 | #247 | Tragic $50,408 |
| Immigrants | Guyana | 1.6 /100 | #248 | Tragic $50,321 |
| Immigrants | Burma/Myanmar | 1.6 /100 | #249 | Tragic $50,298 |
| Osage | 1.6 /100 | #250 | Tragic $50,292 |
| Immigrants | Grenada | 1.6 /100 | #251 | Tragic $50,279 |
| Immigrants | Cabo Verde | 1.2 /100 | #252 | Tragic $50,009 |
| German Russians | 1.1 /100 | #253 | Tragic $49,924 |
| Senegalese | 1.0 /100 | #254 | Tragic $49,774 |
| Alaskan Athabascans | 0.9 /100 | #255 | Tragic $49,748 |
Demographics Similar to South Americans by Median Male Earnings
In terms of median male earnings, the demographic groups most similar to South Americans are South American Indian ($54,508, a difference of 0.030%), Dutch ($54,410, a difference of 0.15%), Spaniard ($54,401, a difference of 0.17%), Welsh ($54,647, a difference of 0.28%), and Immigrants from Peru ($54,695, a difference of 0.37%).
| Demographics | Rating | Rank | Median Male Earnings |
| Immigrants | Fiji | 61.2 /100 | #167 | Good $54,958 |
| Immigrants | Vietnam | 60.2 /100 | #168 | Good $54,913 |
| French Canadians | 55.6 /100 | #169 | Average $54,722 |
| Finns | 55.6 /100 | #170 | Average $54,721 |
| Immigrants | Peru | 54.9 /100 | #171 | Average $54,695 |
| Welsh | 53.8 /100 | #172 | Average $54,647 |
| South American Indians | 50.4 /100 | #173 | Average $54,508 |
| South Americans | 50.0 /100 | #174 | Average $54,492 |
| Dutch | 48.0 /100 | #175 | Average $54,410 |
| Spaniards | 47.8 /100 | #176 | Average $54,401 |
| Costa Ricans | 44.8 /100 | #177 | Average $54,279 |
| Sierra Leoneans | 44.8 /100 | #178 | Average $54,279 |
| Celtics | 43.9 /100 | #179 | Average $54,242 |
| Iraqis | 42.5 /100 | #180 | Average $54,182 |
| Immigrants | Immigrants | 42.1 /100 | #181 | Average $54,168 |