Immigrants from Lebanon vs Chickasaw Householder Income Under 25 years
COMPARE
Immigrants from Lebanon
Chickasaw
Householder Income Under 25 years
Householder Income Under 25 years Comparison
Immigrants from Lebanon
Chickasaw
$50,729
HOUSEHOLDER INCOME UNDER 25 YEARS
2.7/ 100
METRIC RATING
240th/ 347
METRIC RANK
$44,763
HOUSEHOLDER INCOME UNDER 25 YEARS
0.0/ 100
METRIC RATING
338th/ 347
METRIC RANK
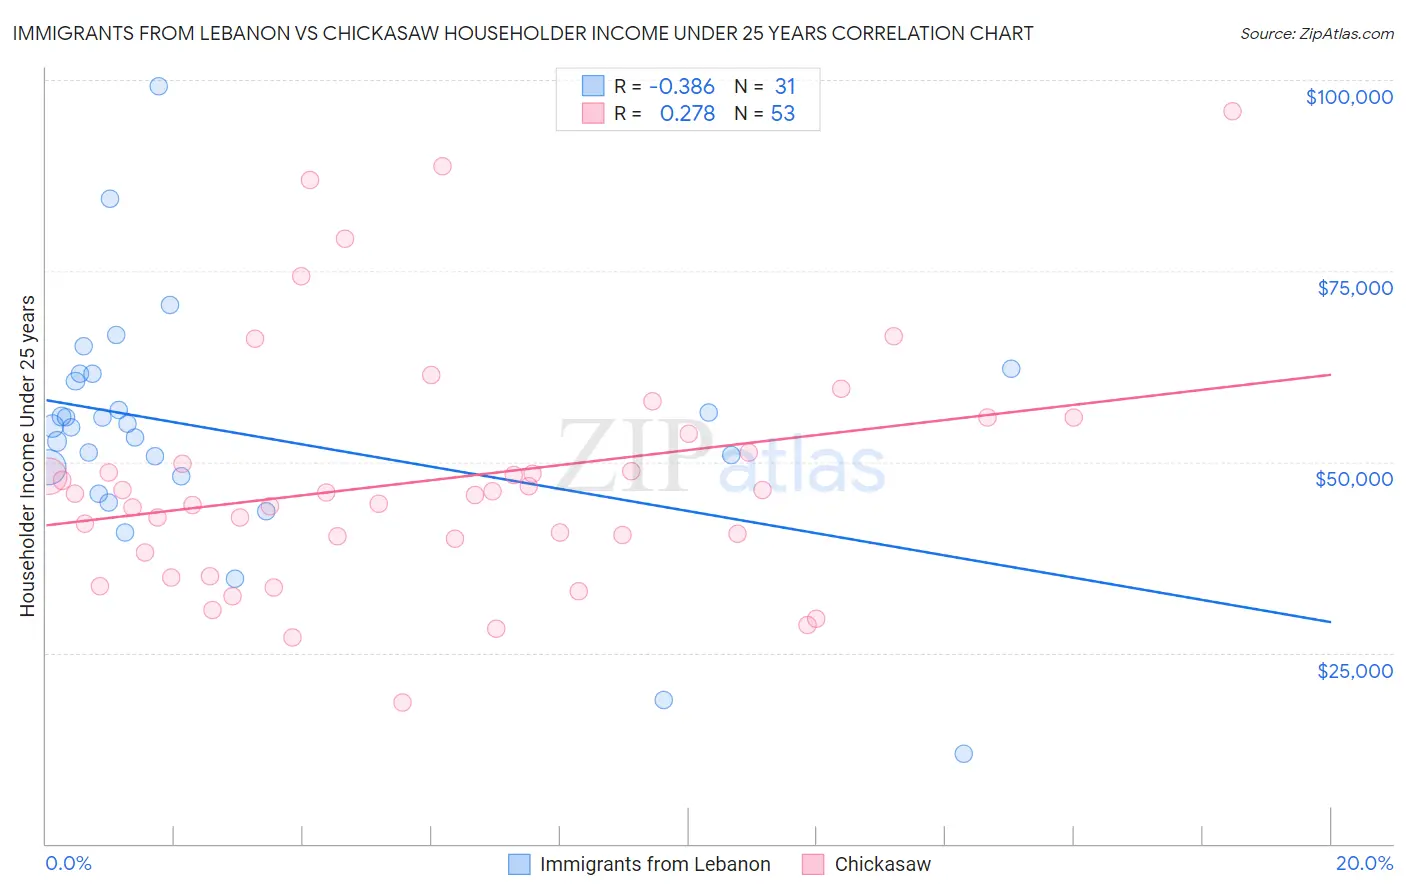
Immigrants from Lebanon vs Chickasaw Householder Income Under 25 years Correlation Chart
The statistical analysis conducted on geographies consisting of 191,197,334 people shows a mild negative correlation between the proportion of Immigrants from Lebanon and household income with householder under the age of 25 in the United States with a correlation coefficient (R) of -0.386 and weighted average of $50,729. Similarly, the statistical analysis conducted on geographies consisting of 137,295,377 people shows a weak positive correlation between the proportion of Chickasaw and household income with householder under the age of 25 in the United States with a correlation coefficient (R) of 0.278 and weighted average of $44,763, a difference of 13.3%.
Householder Income Under 25 years Correlation Summary
| Measurement | Immigrants from Lebanon | Chickasaw |
| Minimum | $11,835 | $18,415 |
| Maximum | $99,135 | $95,833 |
| Range | $87,300 | $77,418 |
| Mean | $53,966 | $47,638 |
| Median | $54,687 | $45,852 |
| Interquartile 25% (IQ1) | $48,163 | $38,980 |
| Interquartile 75% (IQ3) | $61,480 | $52,456 |
| Interquartile Range (IQR) | $13,317 | $13,476 |
| Standard Deviation (Sample) | $15,995 | $15,738 |
| Standard Deviation (Population) | $15,734 | $15,588 |
Similar Demographics by Householder Income Under 25 years
Demographics Similar to Immigrants from Lebanon by Householder Income Under 25 years
In terms of householder income under 25 years, the demographic groups most similar to Immigrants from Lebanon are Immigrants from Caribbean ($50,757, a difference of 0.050%), Immigrants from Micronesia ($50,691, a difference of 0.080%), Iraqi ($50,802, a difference of 0.14%), English ($50,805, a difference of 0.15%), and German ($50,804, a difference of 0.15%).
| Demographics | Rating | Rank | Householder Income Under 25 years |
| Pennsylvania Germans | 3.7 /100 | #233 | Tragic $50,852 |
| Kenyans | 3.3 /100 | #234 | Tragic $50,815 |
| Spanish | 3.3 /100 | #235 | Tragic $50,813 |
| English | 3.3 /100 | #236 | Tragic $50,805 |
| Germans | 3.3 /100 | #237 | Tragic $50,804 |
| Iraqis | 3.2 /100 | #238 | Tragic $50,802 |
| Immigrants | Caribbean | 2.9 /100 | #239 | Tragic $50,757 |
| Immigrants | Lebanon | 2.7 /100 | #240 | Tragic $50,729 |
| Immigrants | Micronesia | 2.5 /100 | #241 | Tragic $50,691 |
| Cubans | 2.3 /100 | #242 | Tragic $50,655 |
| Immigrants | Thailand | 2.2 /100 | #243 | Tragic $50,645 |
| Marshallese | 2.1 /100 | #244 | Tragic $50,627 |
| Immigrants | Africa | 2.0 /100 | #245 | Tragic $50,609 |
| Welsh | 2.0 /100 | #246 | Tragic $50,597 |
| Immigrants | Bosnia and Herzegovina | 1.8 /100 | #247 | Tragic $50,565 |
Demographics Similar to Chickasaw by Householder Income Under 25 years
In terms of householder income under 25 years, the demographic groups most similar to Chickasaw are Kiowa ($44,733, a difference of 0.070%), Pueblo ($45,018, a difference of 0.57%), Black/African American ($44,381, a difference of 0.86%), Houma ($44,356, a difference of 0.92%), and Tohono O'odham ($45,248, a difference of 1.1%).
| Demographics | Rating | Rank | Householder Income Under 25 years |
| Immigrants | Zaire | 0.0 /100 | #331 | Tragic $45,529 |
| Choctaw | 0.0 /100 | #332 | Tragic $45,450 |
| Creek | 0.0 /100 | #333 | Tragic $45,371 |
| Cajuns | 0.0 /100 | #334 | Tragic $45,338 |
| Cheyenne | 0.0 /100 | #335 | Tragic $45,275 |
| Tohono O'odham | 0.0 /100 | #336 | Tragic $45,248 |
| Pueblo | 0.0 /100 | #337 | Tragic $45,018 |
| Chickasaw | 0.0 /100 | #338 | Tragic $44,763 |
| Kiowa | 0.0 /100 | #339 | Tragic $44,733 |
| Blacks/African Americans | 0.0 /100 | #340 | Tragic $44,381 |
| Houma | 0.0 /100 | #341 | Tragic $44,356 |
| Arapaho | 0.0 /100 | #342 | Tragic $44,003 |
| Immigrants | Yemen | 0.0 /100 | #343 | Tragic $43,591 |
| Immigrants | Congo | 0.0 /100 | #344 | Tragic $43,266 |
| Navajo | 0.0 /100 | #345 | Tragic $42,380 |