Native Hawaiian vs Immigrants from Poland 9th Grade
COMPARE
Native Hawaiian
Immigrants from Poland
9th Grade
9th Grade Comparison
Native Hawaiians
Immigrants from Poland
95.9%
9TH GRADE
99.8/ 100
METRIC RATING
60th/ 347
METRIC RANK
94.9%
9TH GRADE
46.7/ 100
METRIC RATING
178th/ 347
METRIC RANK
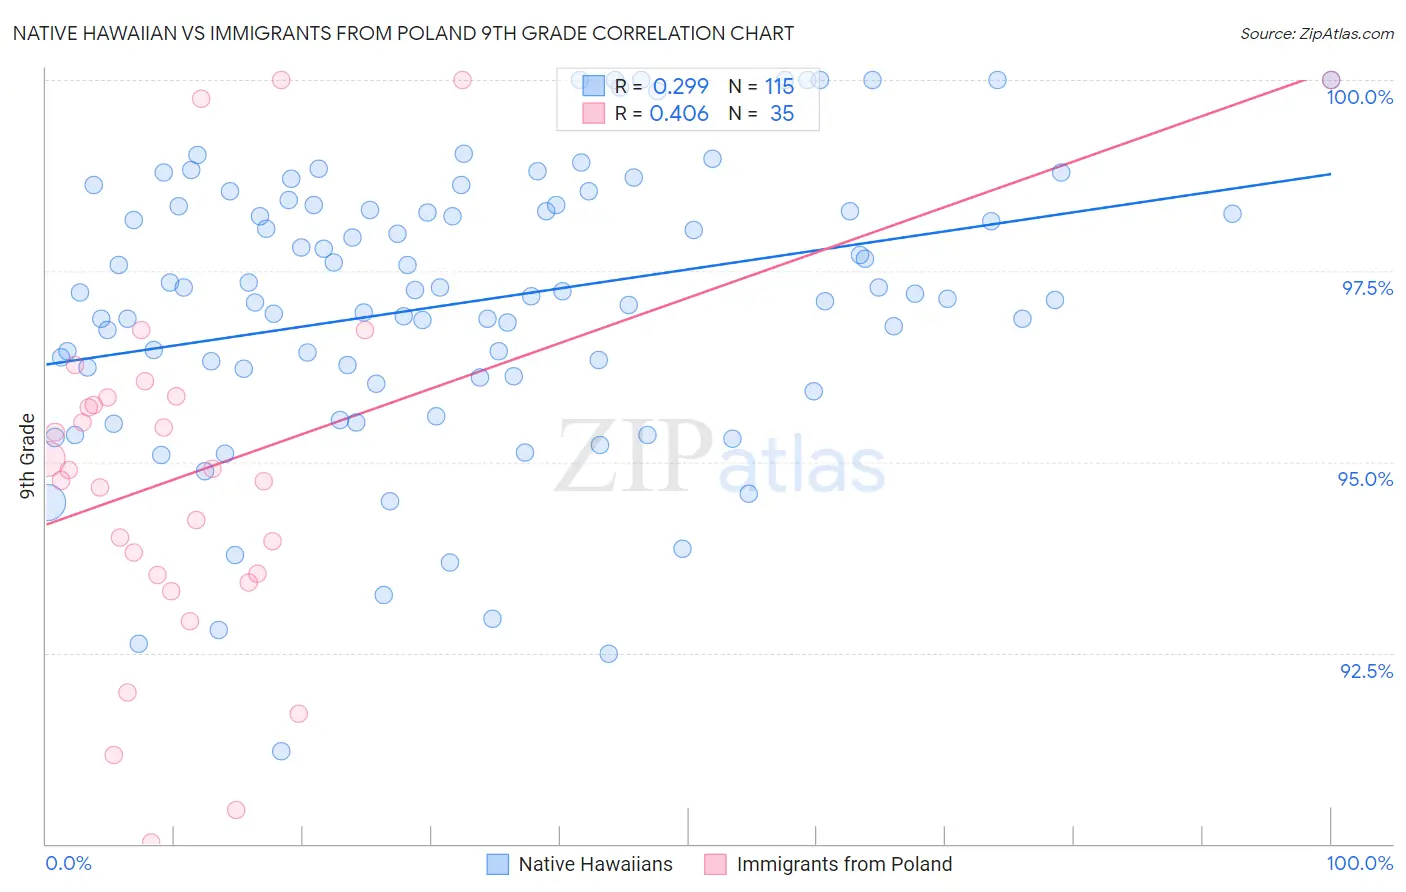
Native Hawaiian vs Immigrants from Poland 9th Grade Correlation Chart
The statistical analysis conducted on geographies consisting of 332,106,425 people shows a weak positive correlation between the proportion of Native Hawaiians and percentage of population with at least 9th grade education in the United States with a correlation coefficient (R) of 0.299 and weighted average of 95.9%. Similarly, the statistical analysis conducted on geographies consisting of 304,861,877 people shows a moderate positive correlation between the proportion of Immigrants from Poland and percentage of population with at least 9th grade education in the United States with a correlation coefficient (R) of 0.406 and weighted average of 94.9%, a difference of 1.1%.
9th Grade Correlation Summary
| Measurement | Native Hawaiian | Immigrants from Poland |
| Minimum | 91.2% | 90.0% |
| Maximum | 100.0% | 100.0% |
| Range | 8.8% | 10.0% |
| Mean | 97.1% | 94.9% |
| Median | 97.2% | 94.9% |
| Interquartile 25% (IQ1) | 96.1% | 93.5% |
| Interquartile 75% (IQ3) | 98.4% | 95.9% |
| Interquartile Range (IQR) | 2.2% | 2.3% |
| Standard Deviation (Sample) | 1.9% | 2.5% |
| Standard Deviation (Population) | 1.8% | 2.4% |
Similar Demographics by 9th Grade
Demographics Similar to Native Hawaiians by 9th Grade
In terms of 9th grade, the demographic groups most similar to Native Hawaiians are Sioux (95.9%, a difference of 0.010%), New Zealander (95.9%, a difference of 0.020%), Ukrainian (95.9%, a difference of 0.020%), Macedonian (96.0%, a difference of 0.030%), and Aleut (96.0%, a difference of 0.030%).
| Demographics | Rating | Rank | 9th Grade |
| Austrians | 99.8 /100 | #53 | Exceptional 96.0% |
| Immigrants | Canada | 99.8 /100 | #54 | Exceptional 96.0% |
| Immigrants | Austria | 99.8 /100 | #55 | Exceptional 96.0% |
| Immigrants | North America | 99.8 /100 | #56 | Exceptional 96.0% |
| Macedonians | 99.8 /100 | #57 | Exceptional 96.0% |
| Aleuts | 99.8 /100 | #58 | Exceptional 96.0% |
| New Zealanders | 99.8 /100 | #59 | Exceptional 95.9% |
| Native Hawaiians | 99.8 /100 | #60 | Exceptional 95.9% |
| Sioux | 99.8 /100 | #61 | Exceptional 95.9% |
| Ukrainians | 99.7 /100 | #62 | Exceptional 95.9% |
| Canadians | 99.7 /100 | #63 | Exceptional 95.9% |
| Zimbabweans | 99.7 /100 | #64 | Exceptional 95.9% |
| Immigrants | England | 99.6 /100 | #65 | Exceptional 95.9% |
| Immigrants | Netherlands | 99.6 /100 | #66 | Exceptional 95.8% |
| Cypriots | 99.6 /100 | #67 | Exceptional 95.8% |
Demographics Similar to Immigrants from Poland by 9th Grade
In terms of 9th grade, the demographic groups most similar to Immigrants from Poland are Immigrants from Venezuela (94.9%, a difference of 0.0%), Immigrants from Iraq (94.9%, a difference of 0.010%), Immigrants from Egypt (94.9%, a difference of 0.020%), Brazilian (94.9%, a difference of 0.020%), and Immigrants from Spain (94.9%, a difference of 0.020%).
| Demographics | Rating | Rank | 9th Grade |
| Colville | 58.5 /100 | #171 | Average 94.9% |
| Iraqis | 54.0 /100 | #172 | Average 94.9% |
| Cheyenne | 51.5 /100 | #173 | Average 94.9% |
| Immigrants | Egypt | 50.0 /100 | #174 | Average 94.9% |
| Brazilians | 49.8 /100 | #175 | Average 94.9% |
| Immigrants | Spain | 49.1 /100 | #176 | Average 94.9% |
| Immigrants | Iraq | 47.8 /100 | #177 | Average 94.9% |
| Immigrants | Poland | 46.7 /100 | #178 | Average 94.9% |
| Immigrants | Venezuela | 46.5 /100 | #179 | Average 94.9% |
| Immigrants | Uganda | 43.1 /100 | #180 | Average 94.8% |
| Sierra Leoneans | 42.7 /100 | #181 | Average 94.8% |
| Seminole | 42.5 /100 | #182 | Average 94.8% |
| Immigrants | Nepal | 39.7 /100 | #183 | Fair 94.8% |
| Argentineans | 37.6 /100 | #184 | Fair 94.8% |
| Liberians | 37.4 /100 | #185 | Fair 94.8% |