Moroccan vs Immigrants from Serbia Poverty
COMPARE
Moroccan
Immigrants from Serbia
Poverty
Poverty Comparison
Moroccans
Immigrants from Serbia
13.2%
POVERTY
5.2/ 100
METRIC RATING
211th/ 347
METRIC RANK
11.1%
POVERTY
98.5/ 100
METRIC RATING
55th/ 347
METRIC RANK
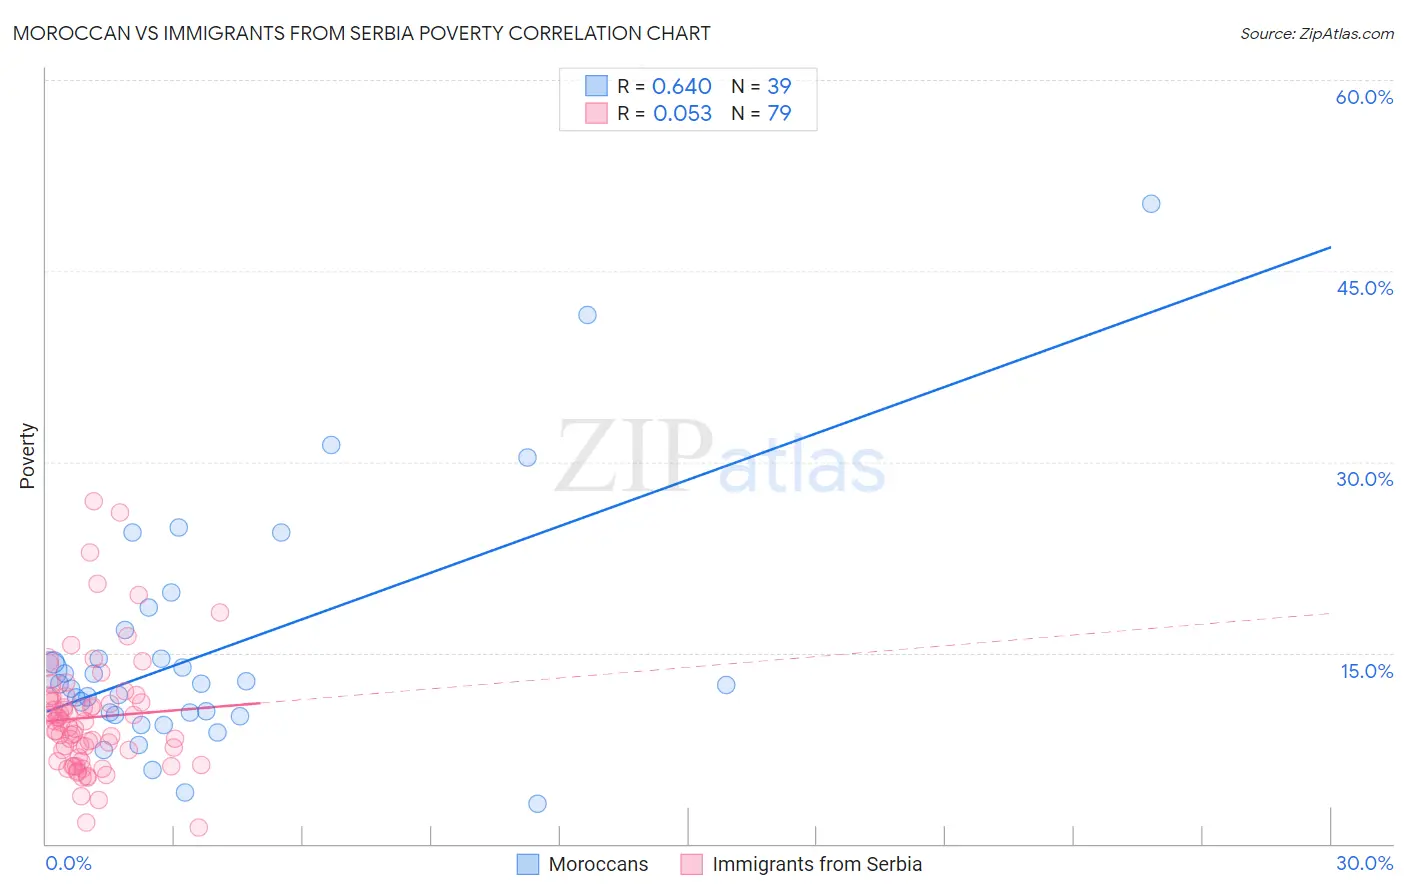
Moroccan vs Immigrants from Serbia Poverty Correlation Chart
The statistical analysis conducted on geographies consisting of 201,757,500 people shows a significant positive correlation between the proportion of Moroccans and poverty level in the United States with a correlation coefficient (R) of 0.640 and weighted average of 13.2%. Similarly, the statistical analysis conducted on geographies consisting of 131,733,920 people shows a slight positive correlation between the proportion of Immigrants from Serbia and poverty level in the United States with a correlation coefficient (R) of 0.053 and weighted average of 11.1%, a difference of 19.1%.
Poverty Correlation Summary
| Measurement | Moroccan | Immigrants from Serbia |
| Minimum | 3.2% | 1.3% |
| Maximum | 50.3% | 26.9% |
| Range | 47.1% | 25.6% |
| Mean | 15.3% | 9.9% |
| Median | 12.5% | 9.1% |
| Interquartile 25% (IQ1) | 10.1% | 6.5% |
| Interquartile 75% (IQ3) | 16.7% | 11.5% |
| Interquartile Range (IQR) | 6.6% | 5.1% |
| Standard Deviation (Sample) | 9.6% | 4.7% |
| Standard Deviation (Population) | 9.5% | 4.7% |
Similar Demographics by Poverty
Demographics Similar to Moroccans by Poverty
In terms of poverty, the demographic groups most similar to Moroccans are Immigrants from the Azores (13.1%, a difference of 0.35%), Malaysian (13.1%, a difference of 0.38%), Ugandan (13.1%, a difference of 0.42%), Immigrants (13.2%, a difference of 0.45%), and Panamanian (13.1%, a difference of 0.57%).
| Demographics | Rating | Rank | Poverty |
| Immigrants | Western Asia | 14.1 /100 | #204 | Poor 12.9% |
| Tsimshian | 9.2 /100 | #205 | Tragic 13.0% |
| Immigrants | Eastern Africa | 7.0 /100 | #206 | Tragic 13.1% |
| Panamanians | 6.6 /100 | #207 | Tragic 13.1% |
| Ugandans | 6.2 /100 | #208 | Tragic 13.1% |
| Malaysians | 6.1 /100 | #209 | Tragic 13.1% |
| Immigrants | Azores | 6.1 /100 | #210 | Tragic 13.1% |
| Moroccans | 5.2 /100 | #211 | Tragic 13.2% |
| Immigrants | Immigrants | 4.3 /100 | #212 | Tragic 13.2% |
| Immigrants | Panama | 4.1 /100 | #213 | Tragic 13.3% |
| Bermudans | 3.7 /100 | #214 | Tragic 13.3% |
| Japanese | 3.3 /100 | #215 | Tragic 13.3% |
| Immigrants | Nonimmigrants | 3.3 /100 | #216 | Tragic 13.3% |
| Immigrants | Uzbekistan | 3.2 /100 | #217 | Tragic 13.3% |
| Immigrants | Thailand | 3.1 /100 | #218 | Tragic 13.3% |
Demographics Similar to Immigrants from Serbia by Poverty
In terms of poverty, the demographic groups most similar to Immigrants from Serbia are Immigrants from Bulgaria (11.1%, a difference of 0.030%), Immigrants from Austria (11.1%, a difference of 0.15%), Immigrants from Philippines (11.0%, a difference of 0.37%), Immigrants from Croatia (11.0%, a difference of 0.39%), and Estonian (11.1%, a difference of 0.48%).
| Demographics | Rating | Rank | Poverty |
| Slovenes | 98.9 /100 | #48 | Exceptional 11.0% |
| Immigrants | Japan | 98.9 /100 | #49 | Exceptional 11.0% |
| Asians | 98.9 /100 | #50 | Exceptional 11.0% |
| Immigrants | Croatia | 98.7 /100 | #51 | Exceptional 11.0% |
| Immigrants | Philippines | 98.7 /100 | #52 | Exceptional 11.0% |
| Immigrants | Austria | 98.6 /100 | #53 | Exceptional 11.1% |
| Immigrants | Bulgaria | 98.5 /100 | #54 | Exceptional 11.1% |
| Immigrants | Serbia | 98.5 /100 | #55 | Exceptional 11.1% |
| Estonians | 98.2 /100 | #56 | Exceptional 11.1% |
| Scandinavians | 98.2 /100 | #57 | Exceptional 11.1% |
| Germans | 98.1 /100 | #58 | Exceptional 11.1% |
| Immigrants | Europe | 98.0 /100 | #59 | Exceptional 11.2% |
| Immigrants | Sri Lanka | 97.9 /100 | #60 | Exceptional 11.2% |
| Immigrants | Italy | 97.9 /100 | #61 | Exceptional 11.2% |
| Austrians | 97.8 /100 | #62 | Exceptional 11.2% |