Moroccan vs Cape Verdean Median Household Income
COMPARE
Moroccan
Cape Verdean
Median Household Income
Median Household Income Comparison
Moroccans
Cape Verdeans
$86,468
MEDIAN HOUSEHOLD INCOME
70.6/ 100
METRIC RATING
158th/ 347
METRIC RANK
$75,848
MEDIAN HOUSEHOLD INCOME
0.3/ 100
METRIC RATING
269th/ 347
METRIC RANK
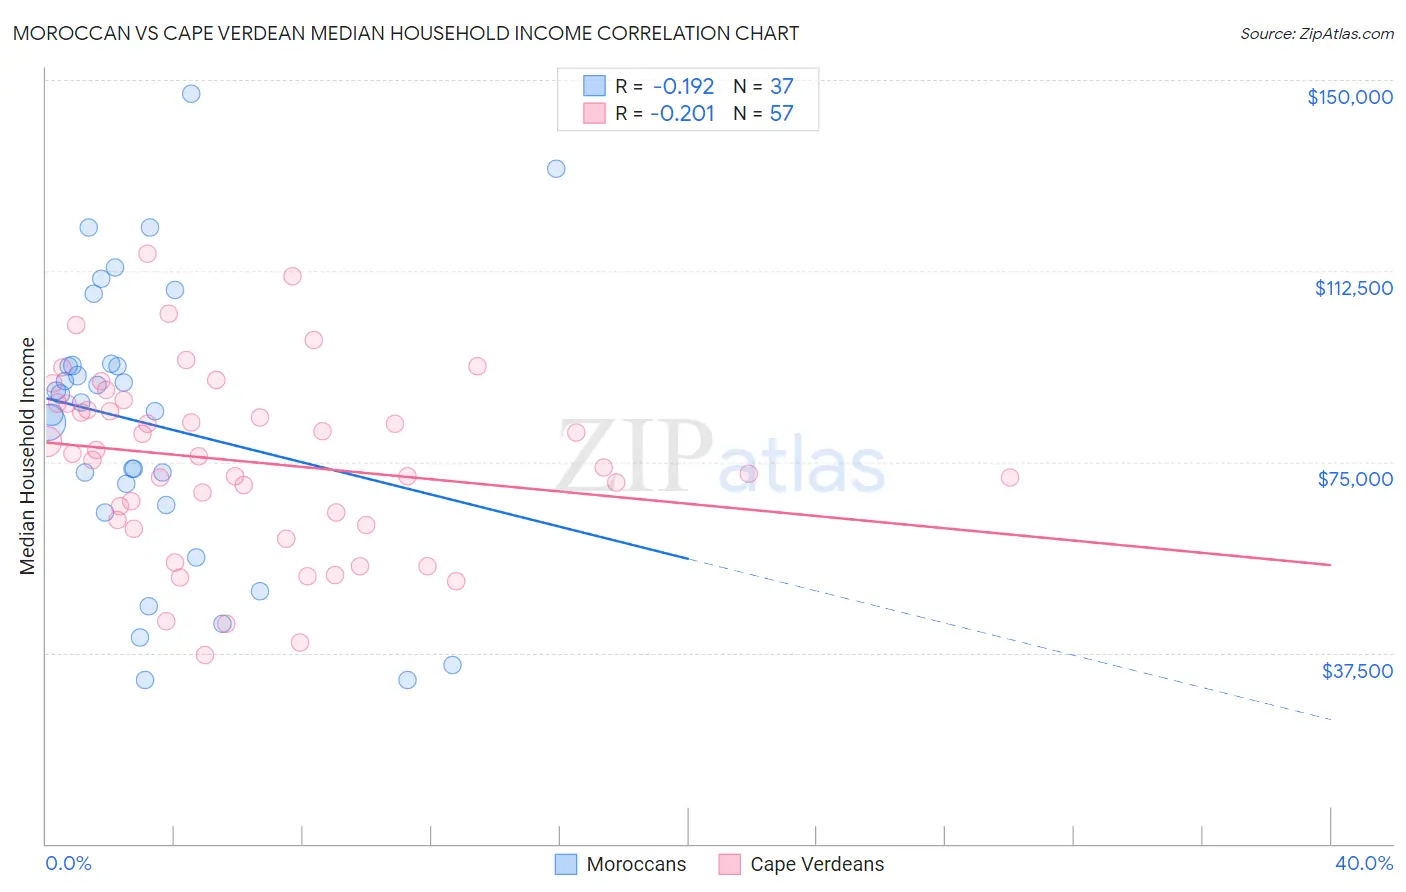
Moroccan vs Cape Verdean Median Household Income Correlation Chart
The statistical analysis conducted on geographies consisting of 201,723,300 people shows a poor negative correlation between the proportion of Moroccans and median household income in the United States with a correlation coefficient (R) of -0.192 and weighted average of $86,468. Similarly, the statistical analysis conducted on geographies consisting of 107,534,548 people shows a weak negative correlation between the proportion of Cape Verdeans and median household income in the United States with a correlation coefficient (R) of -0.201 and weighted average of $75,848, a difference of 14.0%.
Median Household Income Correlation Summary
| Measurement | Moroccan | Cape Verdean |
| Minimum | $32,040 | $37,158 |
| Maximum | $147,408 | $115,791 |
| Range | $115,368 | $78,633 |
| Mean | $82,404 | $75,036 |
| Median | $86,580 | $76,048 |
| Interquartile 25% (IQ1) | $65,781 | $63,051 |
| Interquartile 75% (IQ3) | $94,096 | $86,492 |
| Interquartile Range (IQR) | $28,314 | $23,441 |
| Standard Deviation (Sample) | $28,098 | $17,562 |
| Standard Deviation (Population) | $27,716 | $17,408 |
Similar Demographics by Median Household Income
Demographics Similar to Moroccans by Median Household Income
In terms of median household income, the demographic groups most similar to Moroccans are Samoan ($86,498, a difference of 0.040%), Immigrants from Uzbekistan ($86,425, a difference of 0.050%), Luxembourger ($86,418, a difference of 0.060%), Immigrants from Albania ($86,534, a difference of 0.080%), and Slavic ($86,398, a difference of 0.080%).
| Demographics | Rating | Rank | Median Household Income |
| Hungarians | 76.3 /100 | #151 | Good $86,920 |
| Immigrants | Saudi Arabia | 75.8 /100 | #152 | Good $86,875 |
| South Americans | 75.1 /100 | #153 | Good $86,824 |
| Immigrants | Germany | 74.4 /100 | #154 | Good $86,764 |
| Carpatho Rusyns | 72.8 /100 | #155 | Good $86,635 |
| Immigrants | Albania | 71.5 /100 | #156 | Good $86,534 |
| Samoans | 71.0 /100 | #157 | Good $86,498 |
| Moroccans | 70.6 /100 | #158 | Good $86,468 |
| Immigrants | Uzbekistan | 70.1 /100 | #159 | Good $86,425 |
| Luxembourgers | 70.0 /100 | #160 | Good $86,418 |
| Slavs | 69.7 /100 | #161 | Good $86,398 |
| Guamanians/Chamorros | 67.7 /100 | #162 | Good $86,255 |
| Czechs | 66.4 /100 | #163 | Good $86,164 |
| Irish | 66.2 /100 | #164 | Good $86,145 |
| Norwegians | 65.3 /100 | #165 | Good $86,084 |
Demographics Similar to Cape Verdeans by Median Household Income
In terms of median household income, the demographic groups most similar to Cape Verdeans are Immigrants from Jamaica ($75,851, a difference of 0.0%), German Russian ($75,856, a difference of 0.010%), Hmong ($75,839, a difference of 0.010%), Pennsylvania German ($75,814, a difference of 0.050%), and Somali ($75,782, a difference of 0.090%).
| Demographics | Rating | Rank | Median Household Income |
| French American Indians | 0.4 /100 | #262 | Tragic $76,387 |
| Alaskan Athabascans | 0.4 /100 | #263 | Tragic $76,383 |
| Guatemalans | 0.3 /100 | #264 | Tragic $75,961 |
| Immigrants | Belize | 0.3 /100 | #265 | Tragic $75,938 |
| Americans | 0.3 /100 | #266 | Tragic $75,932 |
| German Russians | 0.3 /100 | #267 | Tragic $75,856 |
| Immigrants | Jamaica | 0.3 /100 | #268 | Tragic $75,851 |
| Cape Verdeans | 0.3 /100 | #269 | Tragic $75,848 |
| Hmong | 0.3 /100 | #270 | Tragic $75,839 |
| Pennsylvania Germans | 0.3 /100 | #271 | Tragic $75,814 |
| Somalis | 0.3 /100 | #272 | Tragic $75,782 |
| Liberians | 0.2 /100 | #273 | Tragic $75,667 |
| British West Indians | 0.2 /100 | #274 | Tragic $75,647 |
| Immigrants | Micronesia | 0.2 /100 | #275 | Tragic $75,574 |
| Immigrants | Latin America | 0.2 /100 | #276 | Tragic $75,420 |