Moroccan vs Immigrants from Barbados Median Household Income
COMPARE
Moroccan
Immigrants from Barbados
Median Household Income
Median Household Income Comparison
Moroccans
Immigrants from Barbados
$86,468
MEDIAN HOUSEHOLD INCOME
70.6/ 100
METRIC RATING
158th/ 347
METRIC RANK
$78,989
MEDIAN HOUSEHOLD INCOME
1.9/ 100
METRIC RATING
243rd/ 347
METRIC RANK
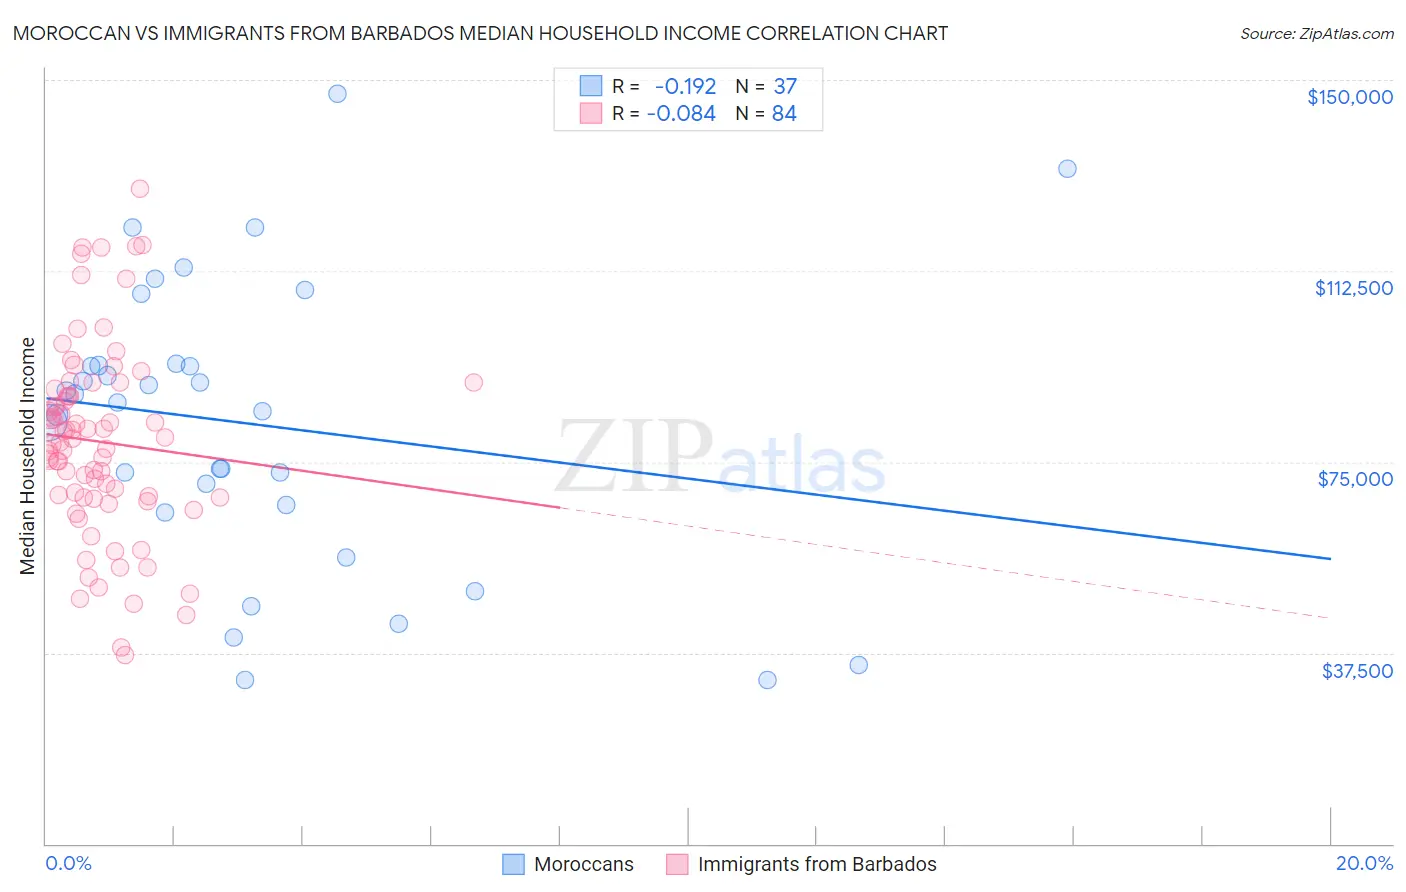
Moroccan vs Immigrants from Barbados Median Household Income Correlation Chart
The statistical analysis conducted on geographies consisting of 201,723,300 people shows a poor negative correlation between the proportion of Moroccans and median household income in the United States with a correlation coefficient (R) of -0.192 and weighted average of $86,468. Similarly, the statistical analysis conducted on geographies consisting of 112,738,981 people shows a slight negative correlation between the proportion of Immigrants from Barbados and median household income in the United States with a correlation coefficient (R) of -0.084 and weighted average of $78,989, a difference of 9.5%.
Median Household Income Correlation Summary
| Measurement | Moroccan | Immigrants from Barbados |
| Minimum | $32,040 | $37,105 |
| Maximum | $147,408 | $128,750 |
| Range | $115,368 | $91,645 |
| Mean | $82,404 | $78,963 |
| Median | $86,580 | $79,093 |
| Interquartile 25% (IQ1) | $65,781 | $67,974 |
| Interquartile 75% (IQ3) | $94,096 | $88,607 |
| Interquartile Range (IQR) | $28,314 | $20,633 |
| Standard Deviation (Sample) | $28,098 | $18,879 |
| Standard Deviation (Population) | $27,716 | $18,767 |
Similar Demographics by Median Household Income
Demographics Similar to Moroccans by Median Household Income
In terms of median household income, the demographic groups most similar to Moroccans are Samoan ($86,498, a difference of 0.040%), Immigrants from Uzbekistan ($86,425, a difference of 0.050%), Luxembourger ($86,418, a difference of 0.060%), Immigrants from Albania ($86,534, a difference of 0.080%), and Slavic ($86,398, a difference of 0.080%).
| Demographics | Rating | Rank | Median Household Income |
| Hungarians | 76.3 /100 | #151 | Good $86,920 |
| Immigrants | Saudi Arabia | 75.8 /100 | #152 | Good $86,875 |
| South Americans | 75.1 /100 | #153 | Good $86,824 |
| Immigrants | Germany | 74.4 /100 | #154 | Good $86,764 |
| Carpatho Rusyns | 72.8 /100 | #155 | Good $86,635 |
| Immigrants | Albania | 71.5 /100 | #156 | Good $86,534 |
| Samoans | 71.0 /100 | #157 | Good $86,498 |
| Moroccans | 70.6 /100 | #158 | Good $86,468 |
| Immigrants | Uzbekistan | 70.1 /100 | #159 | Good $86,425 |
| Luxembourgers | 70.0 /100 | #160 | Good $86,418 |
| Slavs | 69.7 /100 | #161 | Good $86,398 |
| Guamanians/Chamorros | 67.7 /100 | #162 | Good $86,255 |
| Czechs | 66.4 /100 | #163 | Good $86,164 |
| Irish | 66.2 /100 | #164 | Good $86,145 |
| Norwegians | 65.3 /100 | #165 | Good $86,084 |
Demographics Similar to Immigrants from Barbados by Median Household Income
In terms of median household income, the demographic groups most similar to Immigrants from Barbados are Marshallese ($78,930, a difference of 0.080%), Immigrants from Sudan ($79,103, a difference of 0.14%), Inupiat ($78,841, a difference of 0.19%), Central American ($78,803, a difference of 0.24%), and Immigrants from Burma/Myanmar ($78,682, a difference of 0.39%).
| Demographics | Rating | Rank | Median Household Income |
| Immigrants | Bosnia and Herzegovina | 3.4 /100 | #236 | Tragic $79,888 |
| Nicaraguans | 3.1 /100 | #237 | Tragic $79,737 |
| Barbadians | 3.0 /100 | #238 | Tragic $79,664 |
| Alaska Natives | 2.7 /100 | #239 | Tragic $79,509 |
| Immigrants | Western Africa | 2.7 /100 | #240 | Tragic $79,490 |
| Immigrants | Nonimmigrants | 2.6 /100 | #241 | Tragic $79,429 |
| Immigrants | Sudan | 2.1 /100 | #242 | Tragic $79,103 |
| Immigrants | Barbados | 1.9 /100 | #243 | Tragic $78,989 |
| Marshallese | 1.9 /100 | #244 | Tragic $78,930 |
| Inupiat | 1.8 /100 | #245 | Tragic $78,841 |
| Central Americans | 1.7 /100 | #246 | Tragic $78,803 |
| Immigrants | Burma/Myanmar | 1.6 /100 | #247 | Tragic $78,682 |
| Sudanese | 1.5 /100 | #248 | Tragic $78,529 |
| West Indians | 1.4 /100 | #249 | Tragic $78,455 |
| Immigrants | Laos | 1.3 /100 | #250 | Tragic $78,327 |