Moroccan vs Immigrants from France Median Household Income
COMPARE
Moroccan
Immigrants from France
Median Household Income
Median Household Income Comparison
Moroccans
Immigrants from France
$86,468
MEDIAN HOUSEHOLD INCOME
70.6/ 100
METRIC RATING
158th/ 347
METRIC RANK
$96,743
MEDIAN HOUSEHOLD INCOME
99.9/ 100
METRIC RATING
43rd/ 347
METRIC RANK
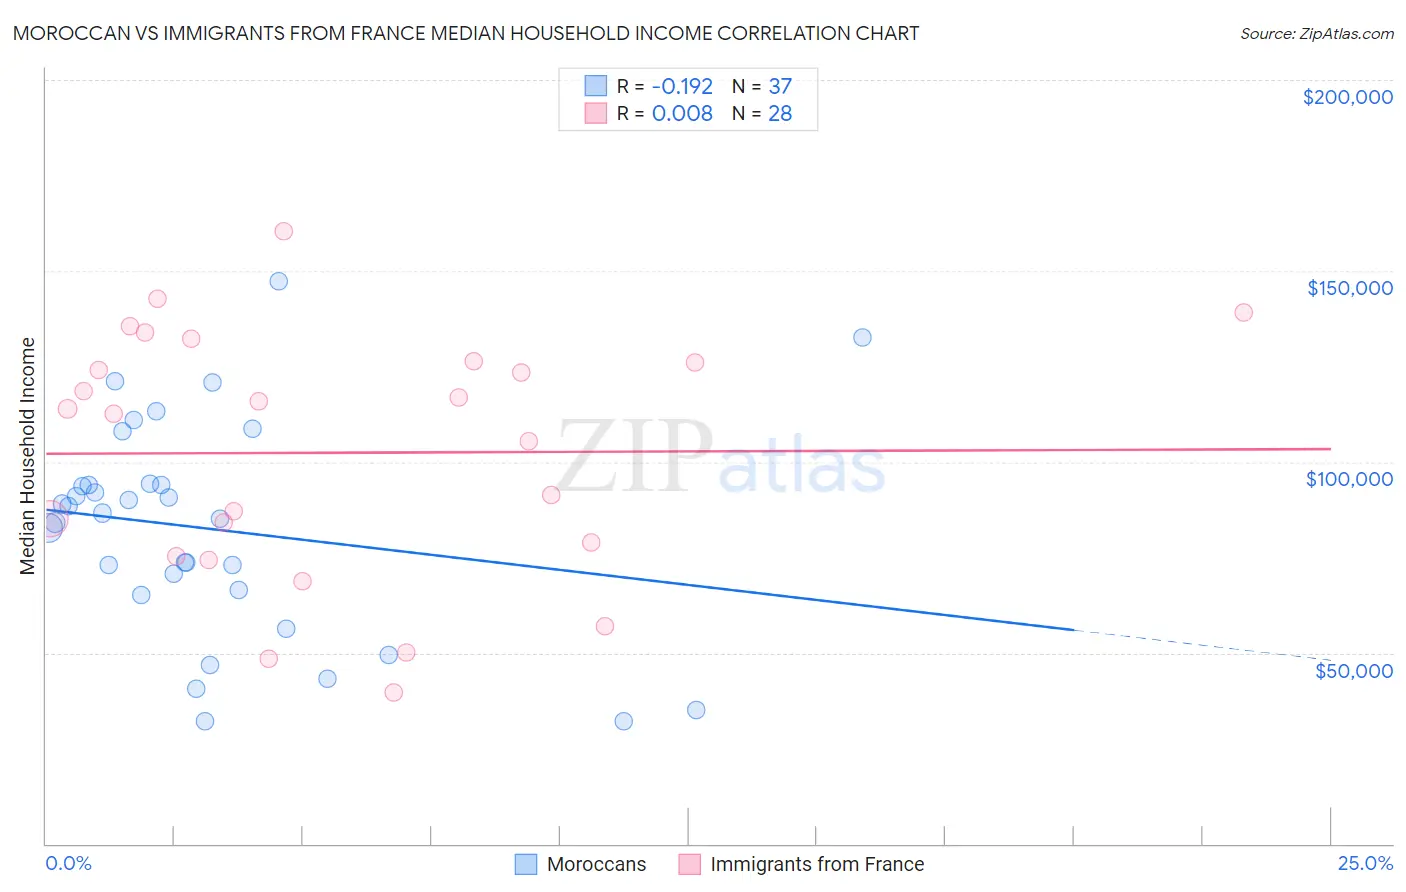
Moroccan vs Immigrants from France Median Household Income Correlation Chart
The statistical analysis conducted on geographies consisting of 201,723,300 people shows a poor negative correlation between the proportion of Moroccans and median household income in the United States with a correlation coefficient (R) of -0.192 and weighted average of $86,468. Similarly, the statistical analysis conducted on geographies consisting of 287,829,118 people shows no correlation between the proportion of Immigrants from France and median household income in the United States with a correlation coefficient (R) of 0.008 and weighted average of $96,743, a difference of 11.9%.
Median Household Income Correlation Summary
| Measurement | Moroccan | Immigrants from France |
| Minimum | $32,040 | $39,667 |
| Maximum | $147,408 | $160,542 |
| Range | $115,368 | $120,875 |
| Mean | $82,404 | $102,392 |
| Median | $86,580 | $113,241 |
| Interquartile 25% (IQ1) | $65,781 | $77,070 |
| Interquartile 75% (IQ3) | $94,096 | $126,188 |
| Interquartile Range (IQR) | $28,314 | $49,118 |
| Standard Deviation (Sample) | $28,098 | $32,282 |
| Standard Deviation (Population) | $27,716 | $31,701 |
Similar Demographics by Median Household Income
Demographics Similar to Moroccans by Median Household Income
In terms of median household income, the demographic groups most similar to Moroccans are Samoan ($86,498, a difference of 0.040%), Immigrants from Uzbekistan ($86,425, a difference of 0.050%), Luxembourger ($86,418, a difference of 0.060%), Immigrants from Albania ($86,534, a difference of 0.080%), and Slavic ($86,398, a difference of 0.080%).
| Demographics | Rating | Rank | Median Household Income |
| Hungarians | 76.3 /100 | #151 | Good $86,920 |
| Immigrants | Saudi Arabia | 75.8 /100 | #152 | Good $86,875 |
| South Americans | 75.1 /100 | #153 | Good $86,824 |
| Immigrants | Germany | 74.4 /100 | #154 | Good $86,764 |
| Carpatho Rusyns | 72.8 /100 | #155 | Good $86,635 |
| Immigrants | Albania | 71.5 /100 | #156 | Good $86,534 |
| Samoans | 71.0 /100 | #157 | Good $86,498 |
| Moroccans | 70.6 /100 | #158 | Good $86,468 |
| Immigrants | Uzbekistan | 70.1 /100 | #159 | Good $86,425 |
| Luxembourgers | 70.0 /100 | #160 | Good $86,418 |
| Slavs | 69.7 /100 | #161 | Good $86,398 |
| Guamanians/Chamorros | 67.7 /100 | #162 | Good $86,255 |
| Czechs | 66.4 /100 | #163 | Good $86,164 |
| Irish | 66.2 /100 | #164 | Good $86,145 |
| Norwegians | 65.3 /100 | #165 | Good $86,084 |
Demographics Similar to Immigrants from France by Median Household Income
In terms of median household income, the demographic groups most similar to Immigrants from France are Immigrants from Greece ($96,675, a difference of 0.070%), Immigrants from Lithuania ($96,836, a difference of 0.10%), Israeli ($96,552, a difference of 0.20%), Immigrants from Turkey ($96,964, a difference of 0.23%), and Australian ($96,490, a difference of 0.26%).
| Demographics | Rating | Rank | Median Household Income |
| Immigrants | Pakistan | 100.0 /100 | #36 | Exceptional $97,528 |
| Latvians | 100.0 /100 | #37 | Exceptional $97,311 |
| Immigrants | Indonesia | 100.0 /100 | #38 | Exceptional $97,297 |
| Afghans | 100.0 /100 | #39 | Exceptional $97,026 |
| Maltese | 100.0 /100 | #40 | Exceptional $97,015 |
| Immigrants | Turkey | 100.0 /100 | #41 | Exceptional $96,964 |
| Immigrants | Lithuania | 99.9 /100 | #42 | Exceptional $96,836 |
| Immigrants | France | 99.9 /100 | #43 | Exceptional $96,743 |
| Immigrants | Greece | 99.9 /100 | #44 | Exceptional $96,675 |
| Israelis | 99.9 /100 | #45 | Exceptional $96,552 |
| Australians | 99.9 /100 | #46 | Exceptional $96,490 |
| Immigrants | Russia | 99.9 /100 | #47 | Exceptional $96,378 |
| Cambodians | 99.9 /100 | #48 | Exceptional $96,324 |
| Immigrants | Malaysia | 99.9 /100 | #49 | Exceptional $96,292 |
| Bulgarians | 99.9 /100 | #50 | Exceptional $96,290 |