Immigrants from Bulgaria vs Immigrants from Uganda Median Earnings
COMPARE
Immigrants from Bulgaria
Immigrants from Uganda
Median Earnings
Median Earnings Comparison
Immigrants from Bulgaria
Immigrants from Uganda
$51,318
MEDIAN EARNINGS
99.9/ 100
METRIC RATING
63rd/ 347
METRIC RANK
$48,041
MEDIAN EARNINGS
90.5/ 100
METRIC RATING
133rd/ 347
METRIC RANK
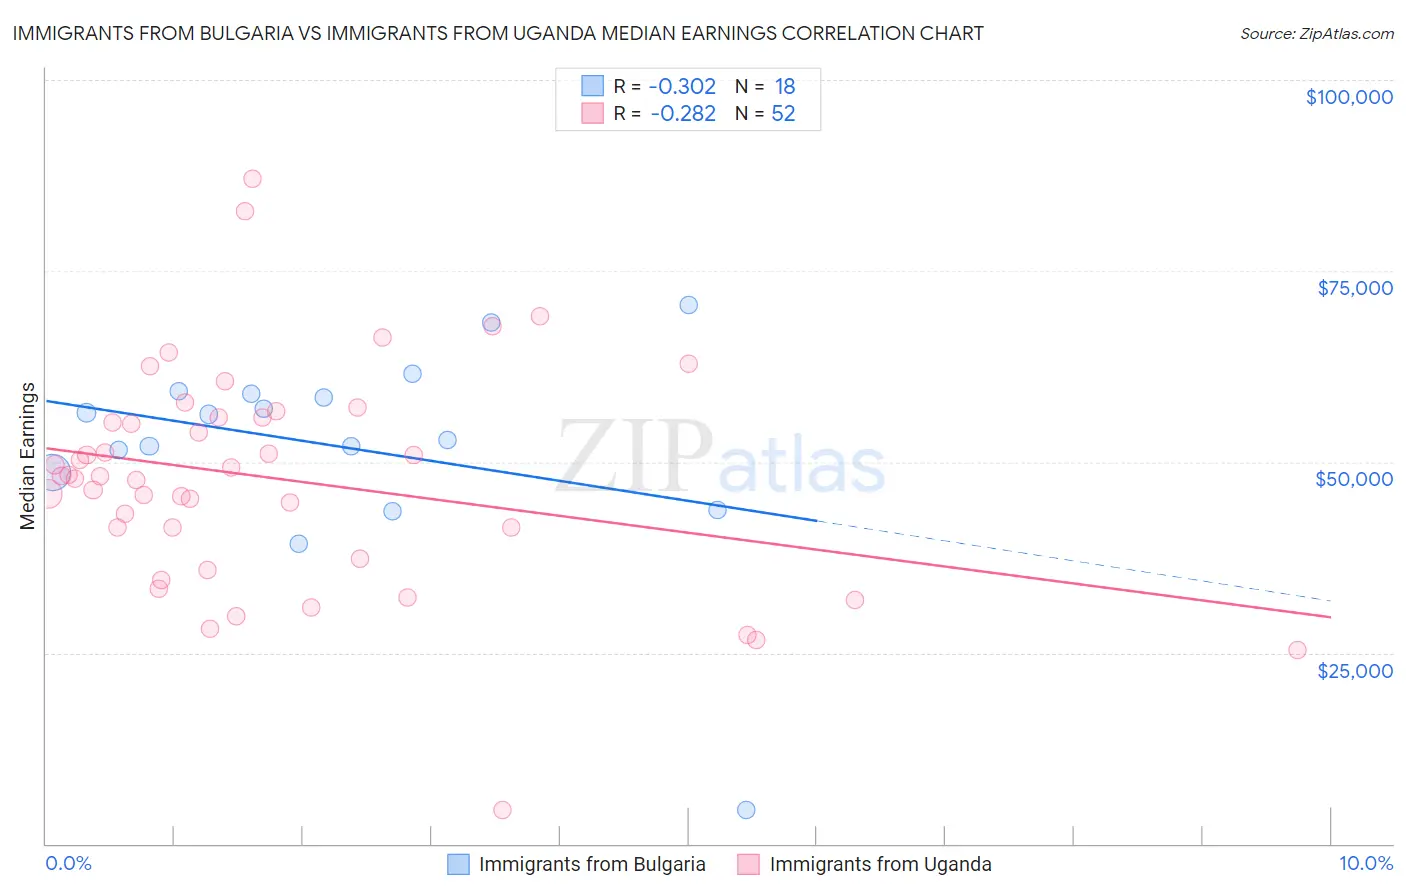
Immigrants from Bulgaria vs Immigrants from Uganda Median Earnings Correlation Chart
The statistical analysis conducted on geographies consisting of 172,536,651 people shows a mild negative correlation between the proportion of Immigrants from Bulgaria and median earnings in the United States with a correlation coefficient (R) of -0.302 and weighted average of $51,318. Similarly, the statistical analysis conducted on geographies consisting of 125,980,560 people shows a weak negative correlation between the proportion of Immigrants from Uganda and median earnings in the United States with a correlation coefficient (R) of -0.282 and weighted average of $48,041, a difference of 6.8%.
Median Earnings Correlation Summary
| Measurement | Immigrants from Bulgaria | Immigrants from Uganda |
| Minimum | $4,447 | $4,426 |
| Maximum | $70,600 | $87,021 |
| Range | $66,153 | $82,595 |
| Mean | $51,928 | $47,722 |
| Median | $54,557 | $48,140 |
| Interquartile 25% (IQ1) | $48,616 | $39,326 |
| Interquartile 75% (IQ3) | $58,987 | $55,755 |
| Interquartile Range (IQR) | $10,371 | $16,429 |
| Standard Deviation (Sample) | $14,304 | $14,671 |
| Standard Deviation (Population) | $13,901 | $14,529 |
Similar Demographics by Median Earnings
Demographics Similar to Immigrants from Bulgaria by Median Earnings
In terms of median earnings, the demographic groups most similar to Immigrants from Bulgaria are Immigrants from Romania ($51,337, a difference of 0.040%), New Zealander ($51,246, a difference of 0.14%), Greek ($51,164, a difference of 0.30%), Afghan ($51,112, a difference of 0.40%), and Immigrants from Spain ($51,092, a difference of 0.44%).
| Demographics | Rating | Rank | Median Earnings |
| Immigrants | Pakistan | 99.9 /100 | #56 | Exceptional $51,693 |
| Immigrants | Eastern Europe | 99.9 /100 | #57 | Exceptional $51,624 |
| Immigrants | Bolivia | 99.9 /100 | #58 | Exceptional $51,605 |
| Immigrants | Croatia | 99.9 /100 | #59 | Exceptional $51,581 |
| Immigrants | Serbia | 99.9 /100 | #60 | Exceptional $51,557 |
| Immigrants | Latvia | 99.9 /100 | #61 | Exceptional $51,555 |
| Immigrants | Romania | 99.9 /100 | #62 | Exceptional $51,337 |
| Immigrants | Bulgaria | 99.9 /100 | #63 | Exceptional $51,318 |
| New Zealanders | 99.9 /100 | #64 | Exceptional $51,246 |
| Greeks | 99.9 /100 | #65 | Exceptional $51,164 |
| Afghans | 99.9 /100 | #66 | Exceptional $51,112 |
| Immigrants | Spain | 99.9 /100 | #67 | Exceptional $51,092 |
| Paraguayans | 99.9 /100 | #68 | Exceptional $51,068 |
| Mongolians | 99.8 /100 | #69 | Exceptional $51,038 |
| Lithuanians | 99.8 /100 | #70 | Exceptional $50,991 |
Demographics Similar to Immigrants from Uganda by Median Earnings
In terms of median earnings, the demographic groups most similar to Immigrants from Uganda are Sri Lankan ($48,040, a difference of 0.0%), Portuguese ($48,032, a difference of 0.020%), Slovene ($47,995, a difference of 0.10%), Immigrants from Nepal ($47,925, a difference of 0.24%), and European ($47,915, a difference of 0.26%).
| Demographics | Rating | Rank | Median Earnings |
| Assyrians/Chaldeans/Syriacs | 93.3 /100 | #126 | Exceptional $48,304 |
| Sierra Leoneans | 93.1 /100 | #127 | Exceptional $48,286 |
| Immigrants | Philippines | 92.9 /100 | #128 | Exceptional $48,266 |
| Pakistanis | 92.8 /100 | #129 | Exceptional $48,254 |
| Zimbabweans | 92.6 /100 | #130 | Exceptional $48,229 |
| Lebanese | 92.5 /100 | #131 | Exceptional $48,226 |
| British | 92.2 /100 | #132 | Exceptional $48,189 |
| Immigrants | Uganda | 90.5 /100 | #133 | Exceptional $48,041 |
| Sri Lankans | 90.5 /100 | #134 | Exceptional $48,040 |
| Portuguese | 90.4 /100 | #135 | Exceptional $48,032 |
| Slovenes | 90.0 /100 | #136 | Excellent $47,995 |
| Immigrants | Nepal | 89.0 /100 | #137 | Excellent $47,925 |
| Europeans | 88.9 /100 | #138 | Excellent $47,915 |
| Canadians | 88.8 /100 | #139 | Excellent $47,911 |
| Taiwanese | 88.7 /100 | #140 | Excellent $47,902 |