Yakama vs Immigrants from Uganda Median Earnings
COMPARE
Yakama
Immigrants from Uganda
Median Earnings
Median Earnings Comparison
Yakama
Immigrants from Uganda
$39,107
MEDIAN EARNINGS
0.0/ 100
METRIC RATING
332nd/ 347
METRIC RANK
$48,041
MEDIAN EARNINGS
90.5/ 100
METRIC RATING
133rd/ 347
METRIC RANK
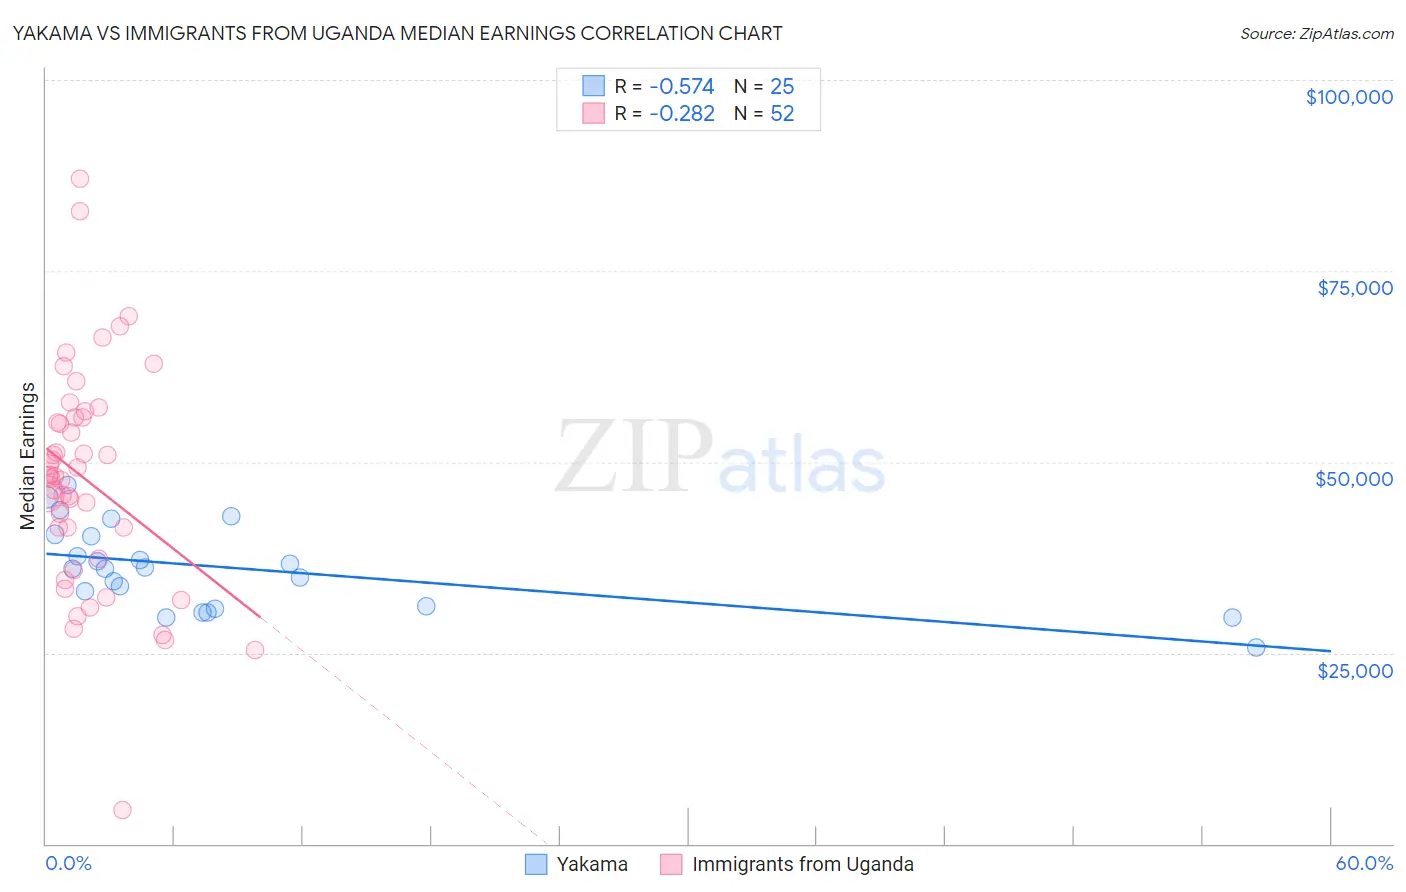
Yakama vs Immigrants from Uganda Median Earnings Correlation Chart
The statistical analysis conducted on geographies consisting of 19,920,783 people shows a substantial negative correlation between the proportion of Yakama and median earnings in the United States with a correlation coefficient (R) of -0.574 and weighted average of $39,107. Similarly, the statistical analysis conducted on geographies consisting of 125,980,560 people shows a weak negative correlation between the proportion of Immigrants from Uganda and median earnings in the United States with a correlation coefficient (R) of -0.282 and weighted average of $48,041, a difference of 22.8%.
Median Earnings Correlation Summary
| Measurement | Yakama | Immigrants from Uganda |
| Minimum | $25,625 | $4,426 |
| Maximum | $46,951 | $87,021 |
| Range | $21,326 | $82,595 |
| Mean | $36,082 | $47,722 |
| Median | $36,058 | $48,140 |
| Interquartile 25% (IQ1) | $30,946 | $39,326 |
| Interquartile 75% (IQ3) | $40,418 | $55,755 |
| Interquartile Range (IQR) | $9,471 | $16,429 |
| Standard Deviation (Sample) | $5,481 | $14,671 |
| Standard Deviation (Population) | $5,370 | $14,529 |
Similar Demographics by Median Earnings
Demographics Similar to Yakama by Median Earnings
In terms of median earnings, the demographic groups most similar to Yakama are Immigrants from Mexico ($39,114, a difference of 0.020%), Immigrants from Congo ($39,169, a difference of 0.16%), Kiowa ($39,232, a difference of 0.32%), Houma ($38,949, a difference of 0.41%), and Spanish American Indian ($38,907, a difference of 0.52%).
| Demographics | Rating | Rank | Median Earnings |
| Creek | 0.0 /100 | #325 | Tragic $39,648 |
| Immigrants | Yemen | 0.0 /100 | #326 | Tragic $39,540 |
| Yuman | 0.0 /100 | #327 | Tragic $39,523 |
| Sioux | 0.0 /100 | #328 | Tragic $39,448 |
| Kiowa | 0.0 /100 | #329 | Tragic $39,232 |
| Immigrants | Congo | 0.0 /100 | #330 | Tragic $39,169 |
| Immigrants | Mexico | 0.0 /100 | #331 | Tragic $39,114 |
| Yakama | 0.0 /100 | #332 | Tragic $39,107 |
| Houma | 0.0 /100 | #333 | Tragic $38,949 |
| Spanish American Indians | 0.0 /100 | #334 | Tragic $38,907 |
| Natives/Alaskans | 0.0 /100 | #335 | Tragic $38,896 |
| Crow | 0.0 /100 | #336 | Tragic $38,707 |
| Immigrants | Cuba | 0.0 /100 | #337 | Tragic $38,426 |
| Pima | 0.0 /100 | #338 | Tragic $38,285 |
| Menominee | 0.0 /100 | #339 | Tragic $37,884 |
Demographics Similar to Immigrants from Uganda by Median Earnings
In terms of median earnings, the demographic groups most similar to Immigrants from Uganda are Sri Lankan ($48,040, a difference of 0.0%), Portuguese ($48,032, a difference of 0.020%), Slovene ($47,995, a difference of 0.10%), Immigrants from Nepal ($47,925, a difference of 0.24%), and European ($47,915, a difference of 0.26%).
| Demographics | Rating | Rank | Median Earnings |
| Assyrians/Chaldeans/Syriacs | 93.3 /100 | #126 | Exceptional $48,304 |
| Sierra Leoneans | 93.1 /100 | #127 | Exceptional $48,286 |
| Immigrants | Philippines | 92.9 /100 | #128 | Exceptional $48,266 |
| Pakistanis | 92.8 /100 | #129 | Exceptional $48,254 |
| Zimbabweans | 92.6 /100 | #130 | Exceptional $48,229 |
| Lebanese | 92.5 /100 | #131 | Exceptional $48,226 |
| British | 92.2 /100 | #132 | Exceptional $48,189 |
| Immigrants | Uganda | 90.5 /100 | #133 | Exceptional $48,041 |
| Sri Lankans | 90.5 /100 | #134 | Exceptional $48,040 |
| Portuguese | 90.4 /100 | #135 | Exceptional $48,032 |
| Slovenes | 90.0 /100 | #136 | Excellent $47,995 |
| Immigrants | Nepal | 89.0 /100 | #137 | Excellent $47,925 |
| Europeans | 88.9 /100 | #138 | Excellent $47,915 |
| Canadians | 88.8 /100 | #139 | Excellent $47,911 |
| Taiwanese | 88.7 /100 | #140 | Excellent $47,902 |