Italian vs Immigrants from Egypt Median Earnings
COMPARE
Italian
Immigrants from Egypt
Median Earnings
Median Earnings Comparison
Italians
Immigrants from Egypt
$49,915
MEDIAN EARNINGS
99.3/ 100
METRIC RATING
90th/ 347
METRIC RANK
$50,901
MEDIAN EARNINGS
99.8/ 100
METRIC RATING
72nd/ 347
METRIC RANK
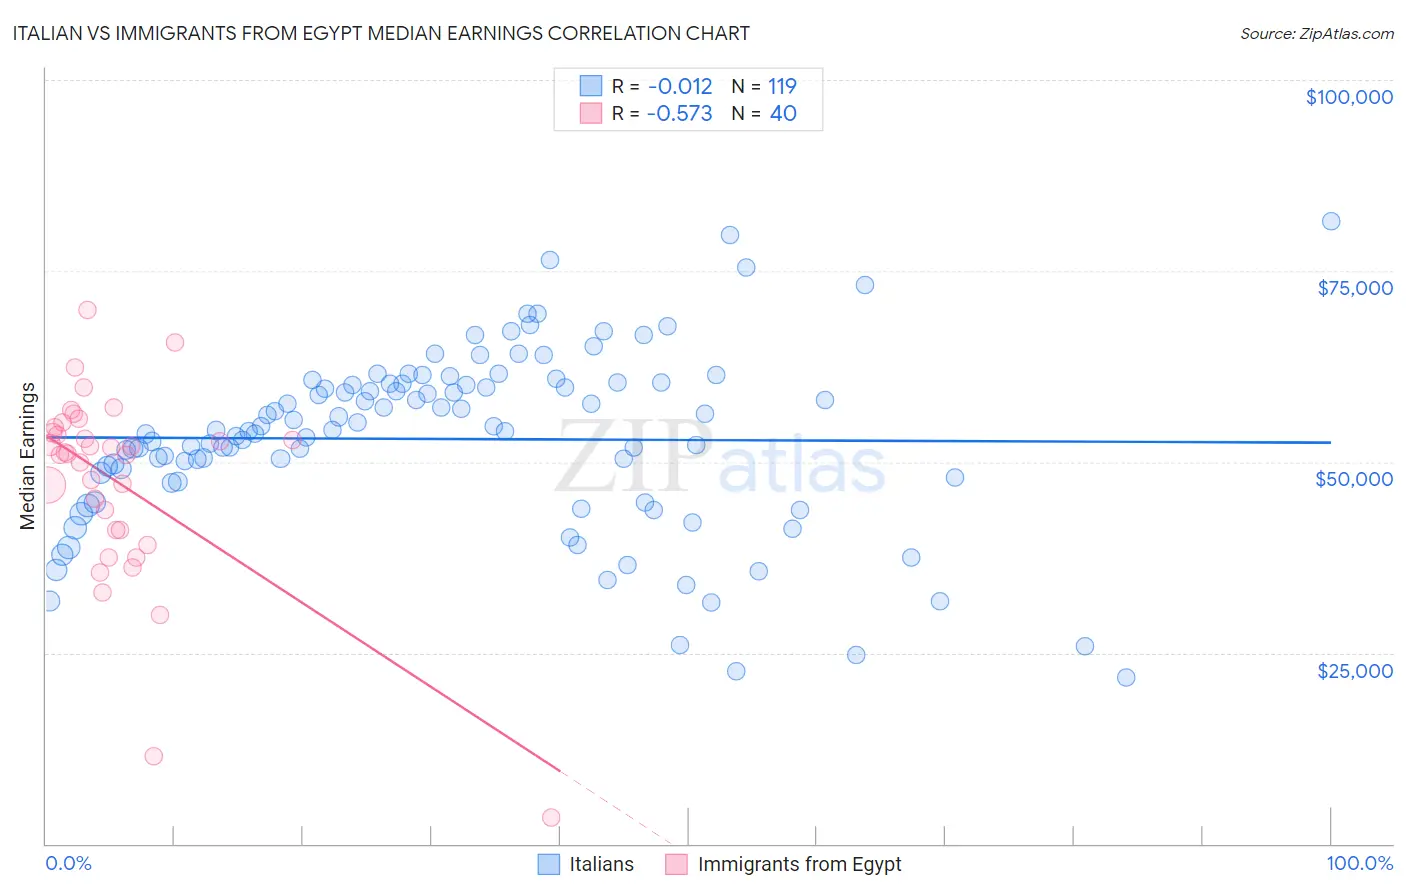
Italian vs Immigrants from Egypt Median Earnings Correlation Chart
The statistical analysis conducted on geographies consisting of 574,669,176 people shows no correlation between the proportion of Italians and median earnings in the United States with a correlation coefficient (R) of -0.012 and weighted average of $49,915. Similarly, the statistical analysis conducted on geographies consisting of 245,492,399 people shows a substantial negative correlation between the proportion of Immigrants from Egypt and median earnings in the United States with a correlation coefficient (R) of -0.573 and weighted average of $50,901, a difference of 2.0%.
Median Earnings Correlation Summary
| Measurement | Italian | Immigrants from Egypt |
| Minimum | $21,728 | $3,500 |
| Maximum | $81,458 | $69,809 |
| Range | $59,730 | $66,309 |
| Mean | $52,992 | $47,452 |
| Median | $54,091 | $51,173 |
| Interquartile 25% (IQ1) | $47,401 | $41,070 |
| Interquartile 75% (IQ3) | $60,200 | $54,227 |
| Interquartile Range (IQR) | $12,799 | $13,157 |
| Standard Deviation (Sample) | $11,690 | $12,746 |
| Standard Deviation (Population) | $11,640 | $12,585 |
Demographics Similar to Italians and Immigrants from Egypt by Median Earnings
In terms of median earnings, the demographic groups most similar to Italians are Macedonian ($49,893, a difference of 0.040%), Immigrants from North America ($50,108, a difference of 0.39%), Albanian ($50,116, a difference of 0.40%), Immigrants from Uzbekistan ($50,151, a difference of 0.47%), and Immigrants from Canada ($50,192, a difference of 0.55%). Similarly, the demographic groups most similar to Immigrants from Egypt are Immigrants from Ukraine ($50,984, a difference of 0.16%), Immigrants from Netherlands ($50,818, a difference of 0.16%), South African ($50,752, a difference of 0.29%), Immigrants from Scotland ($50,741, a difference of 0.32%), and Immigrants from Italy ($50,581, a difference of 0.63%).
| Demographics | Rating | Rank | Median Earnings |
| Immigrants | Ukraine | 99.8 /100 | #71 | Exceptional $50,984 |
| Immigrants | Egypt | 99.8 /100 | #72 | Exceptional $50,901 |
| Immigrants | Netherlands | 99.8 /100 | #73 | Exceptional $50,818 |
| South Africans | 99.8 /100 | #74 | Exceptional $50,752 |
| Immigrants | Scotland | 99.8 /100 | #75 | Exceptional $50,741 |
| Immigrants | Italy | 99.7 /100 | #76 | Exceptional $50,581 |
| Immigrants | Western Europe | 99.7 /100 | #77 | Exceptional $50,549 |
| Argentineans | 99.6 /100 | #78 | Exceptional $50,399 |
| Laotians | 99.6 /100 | #79 | Exceptional $50,343 |
| Ukrainians | 99.6 /100 | #80 | Exceptional $50,320 |
| Immigrants | Southern Europe | 99.6 /100 | #81 | Exceptional $50,280 |
| Immigrants | Moldova | 99.5 /100 | #82 | Exceptional $50,274 |
| Romanians | 99.5 /100 | #83 | Exceptional $50,244 |
| Immigrants | Hungary | 99.5 /100 | #84 | Exceptional $50,227 |
| Immigrants | Kazakhstan | 99.5 /100 | #85 | Exceptional $50,225 |
| Immigrants | Canada | 99.5 /100 | #86 | Exceptional $50,192 |
| Immigrants | Uzbekistan | 99.5 /100 | #87 | Exceptional $50,151 |
| Albanians | 99.4 /100 | #88 | Exceptional $50,116 |
| Immigrants | North America | 99.4 /100 | #89 | Exceptional $50,108 |
| Italians | 99.3 /100 | #90 | Exceptional $49,915 |
| Macedonians | 99.2 /100 | #91 | Exceptional $49,893 |