Immigrants from Colombia vs Immigrants from Egypt Median Earnings
COMPARE
Immigrants from Colombia
Immigrants from Egypt
Median Earnings
Median Earnings Comparison
Immigrants from Colombia
Immigrants from Egypt
$45,550
MEDIAN EARNINGS
22.4/ 100
METRIC RATING
213th/ 347
METRIC RANK
$50,901
MEDIAN EARNINGS
99.8/ 100
METRIC RATING
72nd/ 347
METRIC RANK
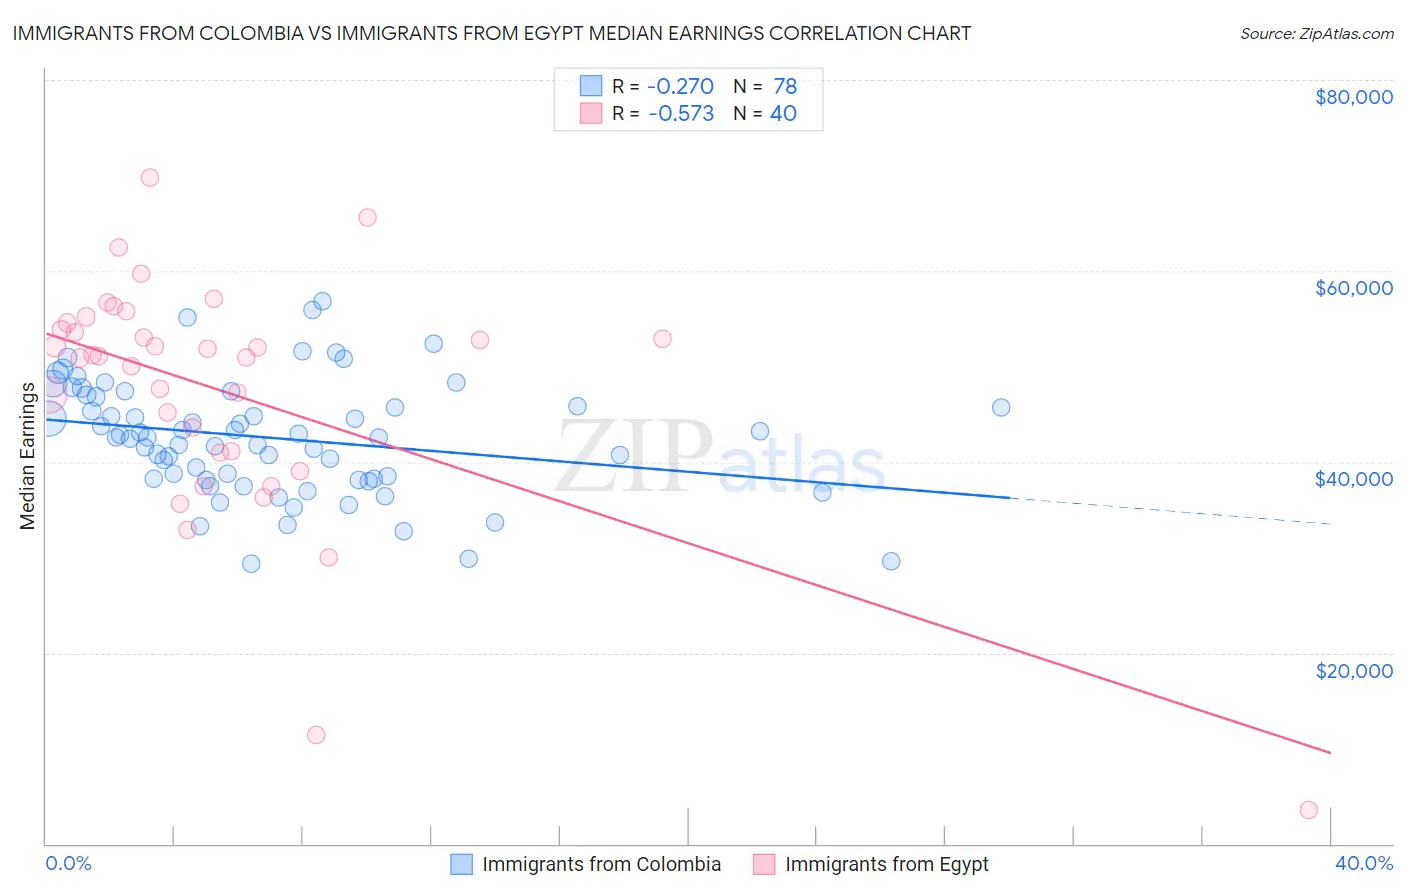
Immigrants from Colombia vs Immigrants from Egypt Median Earnings Correlation Chart
The statistical analysis conducted on geographies consisting of 378,647,626 people shows a weak negative correlation between the proportion of Immigrants from Colombia and median earnings in the United States with a correlation coefficient (R) of -0.270 and weighted average of $45,550. Similarly, the statistical analysis conducted on geographies consisting of 245,492,399 people shows a substantial negative correlation between the proportion of Immigrants from Egypt and median earnings in the United States with a correlation coefficient (R) of -0.573 and weighted average of $50,901, a difference of 11.7%.
Median Earnings Correlation Summary
| Measurement | Immigrants from Colombia | Immigrants from Egypt |
| Minimum | $29,284 | $3,500 |
| Maximum | $56,800 | $69,809 |
| Range | $27,517 | $66,309 |
| Mean | $42,514 | $47,452 |
| Median | $42,568 | $51,173 |
| Interquartile 25% (IQ1) | $38,241 | $41,070 |
| Interquartile 75% (IQ3) | $46,823 | $54,227 |
| Interquartile Range (IQR) | $8,582 | $13,157 |
| Standard Deviation (Sample) | $5,984 | $12,746 |
| Standard Deviation (Population) | $5,945 | $12,585 |
Similar Demographics by Median Earnings
Demographics Similar to Immigrants from Colombia by Median Earnings
In terms of median earnings, the demographic groups most similar to Immigrants from Colombia are Nigerian ($45,532, a difference of 0.040%), Immigrants from Bangladesh ($45,532, a difference of 0.040%), Immigrants from Grenada ($45,596, a difference of 0.10%), Panamanian ($45,593, a difference of 0.10%), and Bermudan ($45,593, a difference of 0.10%).
| Demographics | Rating | Rank | Median Earnings |
| Immigrants | Ghana | 24.8 /100 | #206 | Fair $45,641 |
| Immigrants | Senegal | 24.0 /100 | #207 | Fair $45,611 |
| Immigrants | Bosnia and Herzegovina | 23.7 /100 | #208 | Fair $45,600 |
| Immigrants | Thailand | 23.7 /100 | #209 | Fair $45,598 |
| Immigrants | Grenada | 23.6 /100 | #210 | Fair $45,596 |
| Panamanians | 23.5 /100 | #211 | Fair $45,593 |
| Bermudans | 23.5 /100 | #212 | Fair $45,593 |
| Immigrants | Colombia | 22.4 /100 | #213 | Fair $45,550 |
| Nigerians | 22.0 /100 | #214 | Fair $45,532 |
| Immigrants | Bangladesh | 22.0 /100 | #215 | Fair $45,532 |
| Guyanese | 20.6 /100 | #216 | Fair $45,470 |
| Tlingit-Haida | 20.5 /100 | #217 | Fair $45,468 |
| Spanish | 19.7 /100 | #218 | Poor $45,432 |
| Dutch | 18.4 /100 | #219 | Poor $45,370 |
| Ecuadorians | 15.3 /100 | #220 | Poor $45,214 |
Demographics Similar to Immigrants from Egypt by Median Earnings
In terms of median earnings, the demographic groups most similar to Immigrants from Egypt are Immigrants from Ukraine ($50,984, a difference of 0.16%), Immigrants from Netherlands ($50,818, a difference of 0.16%), Lithuanian ($50,991, a difference of 0.18%), Mongolian ($51,038, a difference of 0.27%), and South African ($50,752, a difference of 0.29%).
| Demographics | Rating | Rank | Median Earnings |
| Greeks | 99.9 /100 | #65 | Exceptional $51,164 |
| Afghans | 99.9 /100 | #66 | Exceptional $51,112 |
| Immigrants | Spain | 99.9 /100 | #67 | Exceptional $51,092 |
| Paraguayans | 99.9 /100 | #68 | Exceptional $51,068 |
| Mongolians | 99.8 /100 | #69 | Exceptional $51,038 |
| Lithuanians | 99.8 /100 | #70 | Exceptional $50,991 |
| Immigrants | Ukraine | 99.8 /100 | #71 | Exceptional $50,984 |
| Immigrants | Egypt | 99.8 /100 | #72 | Exceptional $50,901 |
| Immigrants | Netherlands | 99.8 /100 | #73 | Exceptional $50,818 |
| South Africans | 99.8 /100 | #74 | Exceptional $50,752 |
| Immigrants | Scotland | 99.8 /100 | #75 | Exceptional $50,741 |
| Immigrants | Italy | 99.7 /100 | #76 | Exceptional $50,581 |
| Immigrants | Western Europe | 99.7 /100 | #77 | Exceptional $50,549 |
| Argentineans | 99.6 /100 | #78 | Exceptional $50,399 |
| Laotians | 99.6 /100 | #79 | Exceptional $50,343 |