Menominee vs Immigrants from Uzbekistan Single Male Poverty
COMPARE
Menominee
Immigrants from Uzbekistan
Single Male Poverty
Single Male Poverty Comparison
Menominee
Immigrants from Uzbekistan
17.7%
SINGLE MALE POVERTY
0.0/ 100
METRIC RATING
327th/ 347
METRIC RANK
11.7%
SINGLE MALE POVERTY
99.9/ 100
METRIC RATING
54th/ 347
METRIC RANK
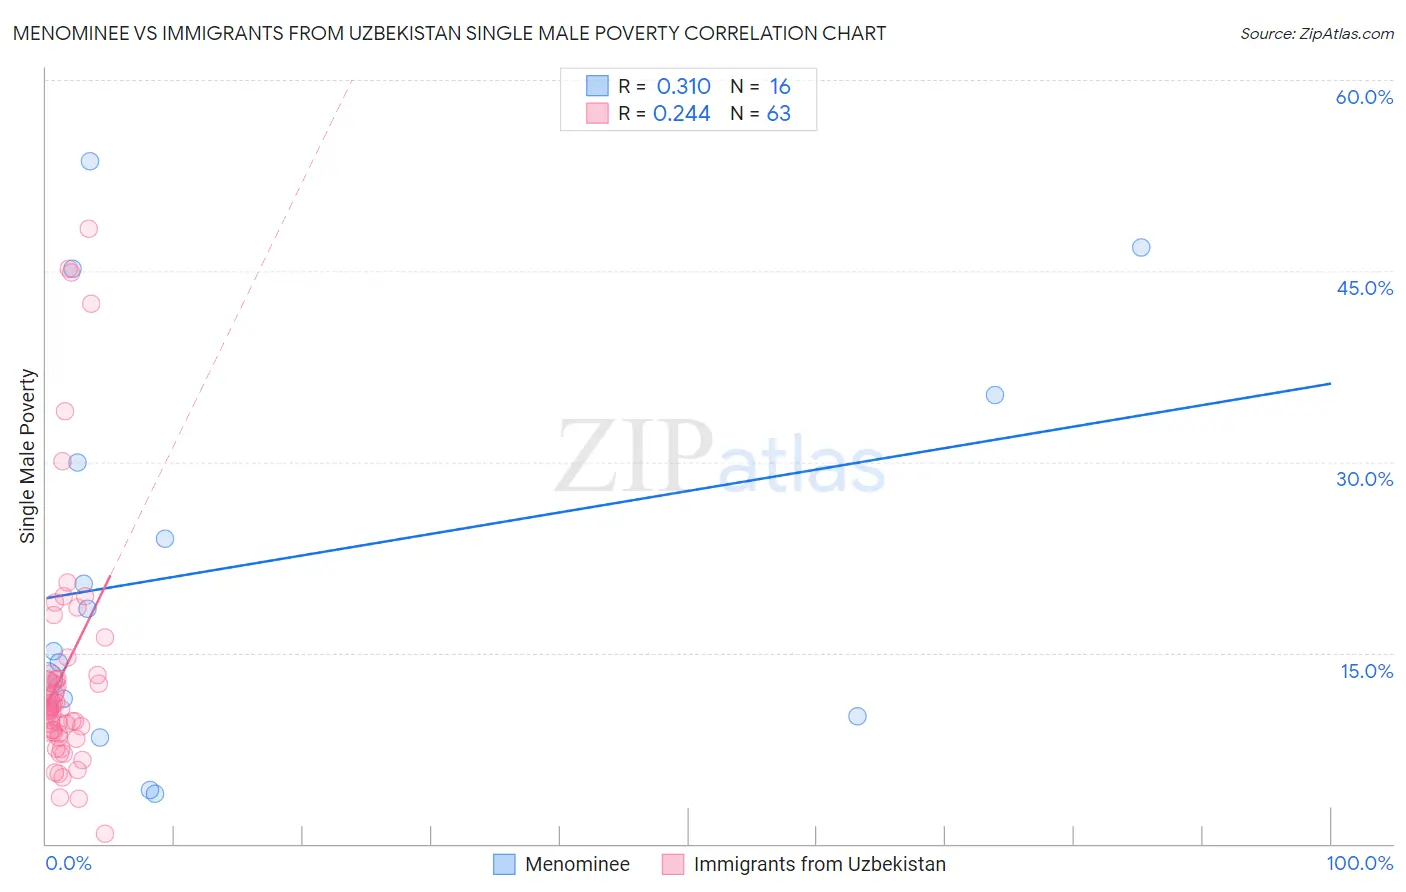
Menominee vs Immigrants from Uzbekistan Single Male Poverty Correlation Chart
The statistical analysis conducted on geographies consisting of 44,140,338 people shows a mild positive correlation between the proportion of Menominee and poverty level among single males in the United States with a correlation coefficient (R) of 0.310 and weighted average of 17.7%. Similarly, the statistical analysis conducted on geographies consisting of 112,516,380 people shows a weak positive correlation between the proportion of Immigrants from Uzbekistan and poverty level among single males in the United States with a correlation coefficient (R) of 0.244 and weighted average of 11.7%, a difference of 51.9%.
Single Male Poverty Correlation Summary
| Measurement | Menominee | Immigrants from Uzbekistan |
| Minimum | 3.9% | 0.78% |
| Maximum | 53.7% | 48.3% |
| Range | 49.8% | 47.5% |
| Mean | 22.1% | 13.5% |
| Median | 16.8% | 10.7% |
| Interquartile 25% (IQ1) | 10.7% | 8.7% |
| Interquartile 75% (IQ3) | 32.6% | 13.3% |
| Interquartile Range (IQR) | 22.0% | 4.5% |
| Standard Deviation (Sample) | 15.7% | 9.9% |
| Standard Deviation (Population) | 15.2% | 9.9% |
Similar Demographics by Single Male Poverty
Demographics Similar to Menominee by Single Male Poverty
In terms of single male poverty, the demographic groups most similar to Menominee are Central American Indian (17.2%, a difference of 2.7%), Kiowa (18.3%, a difference of 3.3%), Colville (18.4%, a difference of 4.0%), Choctaw (17.0%, a difference of 4.3%), and Immigrants from Yemen (16.9%, a difference of 5.1%).
| Demographics | Rating | Rank | Single Male Poverty |
| Marshallese | 0.0 /100 | #320 | Tragic 16.4% |
| Osage | 0.0 /100 | #321 | Tragic 16.5% |
| Shoshone | 0.0 /100 | #322 | Tragic 16.7% |
| Creek | 0.0 /100 | #323 | Tragic 16.8% |
| Immigrants | Yemen | 0.0 /100 | #324 | Tragic 16.9% |
| Choctaw | 0.0 /100 | #325 | Tragic 17.0% |
| Central American Indians | 0.0 /100 | #326 | Tragic 17.2% |
| Menominee | 0.0 /100 | #327 | Tragic 17.7% |
| Kiowa | 0.0 /100 | #328 | Tragic 18.3% |
| Colville | 0.0 /100 | #329 | Tragic 18.4% |
| Cajuns | 0.0 /100 | #330 | Tragic 19.1% |
| Paiute | 0.0 /100 | #331 | Tragic 19.3% |
| Natives/Alaskans | 0.0 /100 | #332 | Tragic 19.6% |
| Inupiat | 0.0 /100 | #333 | Tragic 20.0% |
| Pima | 0.0 /100 | #334 | Tragic 20.2% |
Demographics Similar to Immigrants from Uzbekistan by Single Male Poverty
In terms of single male poverty, the demographic groups most similar to Immigrants from Uzbekistan are Bulgarian (11.7%, a difference of 0.020%), Samoan (11.7%, a difference of 0.12%), Cypriot (11.7%, a difference of 0.17%), Paraguayan (11.6%, a difference of 0.43%), and Burmese (11.7%, a difference of 0.48%).
| Demographics | Rating | Rank | Single Male Poverty |
| Nepalese | 99.9 /100 | #47 | Exceptional 11.6% |
| Immigrants | Indonesia | 99.9 /100 | #48 | Exceptional 11.6% |
| Tlingit-Haida | 99.9 /100 | #49 | Exceptional 11.6% |
| Immigrants | Lithuania | 99.9 /100 | #50 | Exceptional 11.6% |
| Paraguayans | 99.9 /100 | #51 | Exceptional 11.6% |
| Samoans | 99.9 /100 | #52 | Exceptional 11.7% |
| Bulgarians | 99.9 /100 | #53 | Exceptional 11.7% |
| Immigrants | Uzbekistan | 99.9 /100 | #54 | Exceptional 11.7% |
| Cypriots | 99.9 /100 | #55 | Exceptional 11.7% |
| Burmese | 99.8 /100 | #56 | Exceptional 11.7% |
| Immigrants | Romania | 99.8 /100 | #57 | Exceptional 11.7% |
| Immigrants | Brazil | 99.8 /100 | #58 | Exceptional 11.7% |
| Brazilians | 99.8 /100 | #59 | Exceptional 11.8% |
| Peruvians | 99.8 /100 | #60 | Exceptional 11.8% |
| Cambodians | 99.8 /100 | #61 | Exceptional 11.8% |