Immigrants from Canada vs Immigrants from Uzbekistan Wage/Income Gap
COMPARE
Immigrants from Canada
Immigrants from Uzbekistan
Wage/Income Gap
Wage/Income Gap Comparison
Immigrants from Canada
Immigrants from Uzbekistan
28.5%
WAGE/INCOME GAP
0.2/ 100
METRIC RATING
301st/ 347
METRIC RANK
22.7%
WAGE/INCOME GAP
99.9/ 100
METRIC RATING
70th/ 347
METRIC RANK
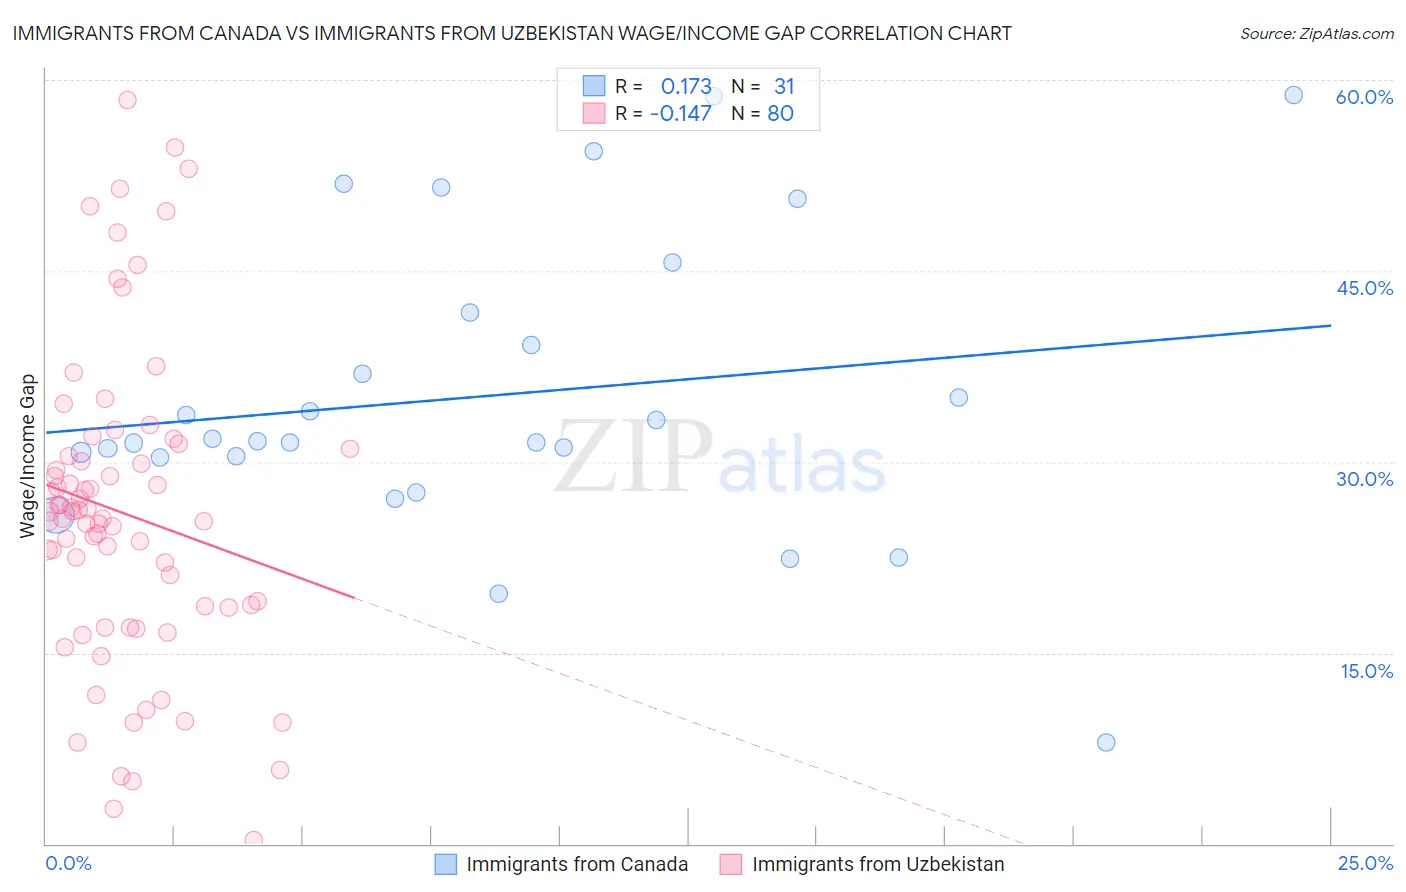
Immigrants from Canada vs Immigrants from Uzbekistan Wage/Income Gap Correlation Chart
The statistical analysis conducted on geographies consisting of 458,790,816 people shows a poor positive correlation between the proportion of Immigrants from Canada and wage/income gap percentage in the United States with a correlation coefficient (R) of 0.173 and weighted average of 28.5%. Similarly, the statistical analysis conducted on geographies consisting of 118,761,905 people shows a poor negative correlation between the proportion of Immigrants from Uzbekistan and wage/income gap percentage in the United States with a correlation coefficient (R) of -0.147 and weighted average of 22.7%, a difference of 25.1%.
Wage/Income Gap Correlation Summary
| Measurement | Immigrants from Canada | Immigrants from Uzbekistan |
| Minimum | 8.0% | 0.26% |
| Maximum | 58.9% | 58.5% |
| Range | 50.9% | 58.2% |
| Mean | 35.2% | 26.0% |
| Median | 31.6% | 25.8% |
| Interquartile 25% (IQ1) | 30.4% | 18.6% |
| Interquartile 75% (IQ3) | 41.7% | 30.7% |
| Interquartile Range (IQR) | 11.3% | 12.1% |
| Standard Deviation (Sample) | 11.7% | 12.3% |
| Standard Deviation (Population) | 11.5% | 12.2% |
Similar Demographics by Wage/Income Gap
Demographics Similar to Immigrants from Canada by Wage/Income Gap
In terms of wage/income gap, the demographic groups most similar to Immigrants from Canada are Scotch-Irish (28.5%, a difference of 0.030%), Irish (28.5%, a difference of 0.030%), Immigrants from Northern Europe (28.5%, a difference of 0.040%), Immigrants from Netherlands (28.5%, a difference of 0.11%), and Immigrants from South Africa (28.5%, a difference of 0.13%).
| Demographics | Rating | Rank | Wage/Income Gap |
| Greeks | 0.3 /100 | #294 | Tragic 28.2% |
| Slovenes | 0.3 /100 | #295 | Tragic 28.3% |
| Northern Europeans | 0.3 /100 | #296 | Tragic 28.3% |
| Immigrants | North America | 0.2 /100 | #297 | Tragic 28.4% |
| Austrians | 0.2 /100 | #298 | Tragic 28.4% |
| Immigrants | North Macedonia | 0.2 /100 | #299 | Tragic 28.4% |
| Immigrants | Northern Europe | 0.2 /100 | #300 | Tragic 28.5% |
| Immigrants | Canada | 0.2 /100 | #301 | Tragic 28.5% |
| Scotch-Irish | 0.2 /100 | #302 | Tragic 28.5% |
| Irish | 0.2 /100 | #303 | Tragic 28.5% |
| Immigrants | Netherlands | 0.2 /100 | #304 | Tragic 28.5% |
| Immigrants | South Africa | 0.1 /100 | #305 | Tragic 28.5% |
| Whites/Caucasians | 0.1 /100 | #306 | Tragic 28.5% |
| Immigrants | Denmark | 0.1 /100 | #307 | Tragic 28.5% |
| Poles | 0.1 /100 | #308 | Tragic 28.5% |
Demographics Similar to Immigrants from Uzbekistan by Wage/Income Gap
In terms of wage/income gap, the demographic groups most similar to Immigrants from Uzbekistan are Indonesian (22.7%, a difference of 0.11%), Immigrants from Nigeria (22.7%, a difference of 0.14%), Menominee (22.7%, a difference of 0.15%), Immigrants from El Salvador (22.8%, a difference of 0.17%), and Subsaharan African (22.8%, a difference of 0.31%).
| Demographics | Rating | Rank | Wage/Income Gap |
| Immigrants | Ecuador | 100.0 /100 | #63 | Exceptional 22.5% |
| Spanish American Indians | 100.0 /100 | #64 | Exceptional 22.5% |
| Guatemalans | 99.9 /100 | #65 | Exceptional 22.6% |
| Central American Indians | 99.9 /100 | #66 | Exceptional 22.7% |
| Menominee | 99.9 /100 | #67 | Exceptional 22.7% |
| Immigrants | Nigeria | 99.9 /100 | #68 | Exceptional 22.7% |
| Indonesians | 99.9 /100 | #69 | Exceptional 22.7% |
| Immigrants | Uzbekistan | 99.9 /100 | #70 | Exceptional 22.7% |
| Immigrants | El Salvador | 99.9 /100 | #71 | Exceptional 22.8% |
| Sub-Saharan Africans | 99.9 /100 | #72 | Exceptional 22.8% |
| Immigrants | Eastern Africa | 99.9 /100 | #73 | Exceptional 22.8% |
| Immigrants | Burma/Myanmar | 99.9 /100 | #74 | Exceptional 22.8% |
| Fijians | 99.9 /100 | #75 | Exceptional 22.9% |
| Ecuadorians | 99.9 /100 | #76 | Exceptional 22.9% |
| Africans | 99.9 /100 | #77 | Exceptional 22.9% |