Marshallese vs Dutch Median Earnings
COMPARE
Marshallese
Dutch
Median Earnings
Median Earnings Comparison
Marshallese
Dutch
$41,969
MEDIAN EARNINGS
0.2/ 100
METRIC RATING
281st/ 347
METRIC RANK
$45,370
MEDIAN EARNINGS
18.4/ 100
METRIC RATING
219th/ 347
METRIC RANK
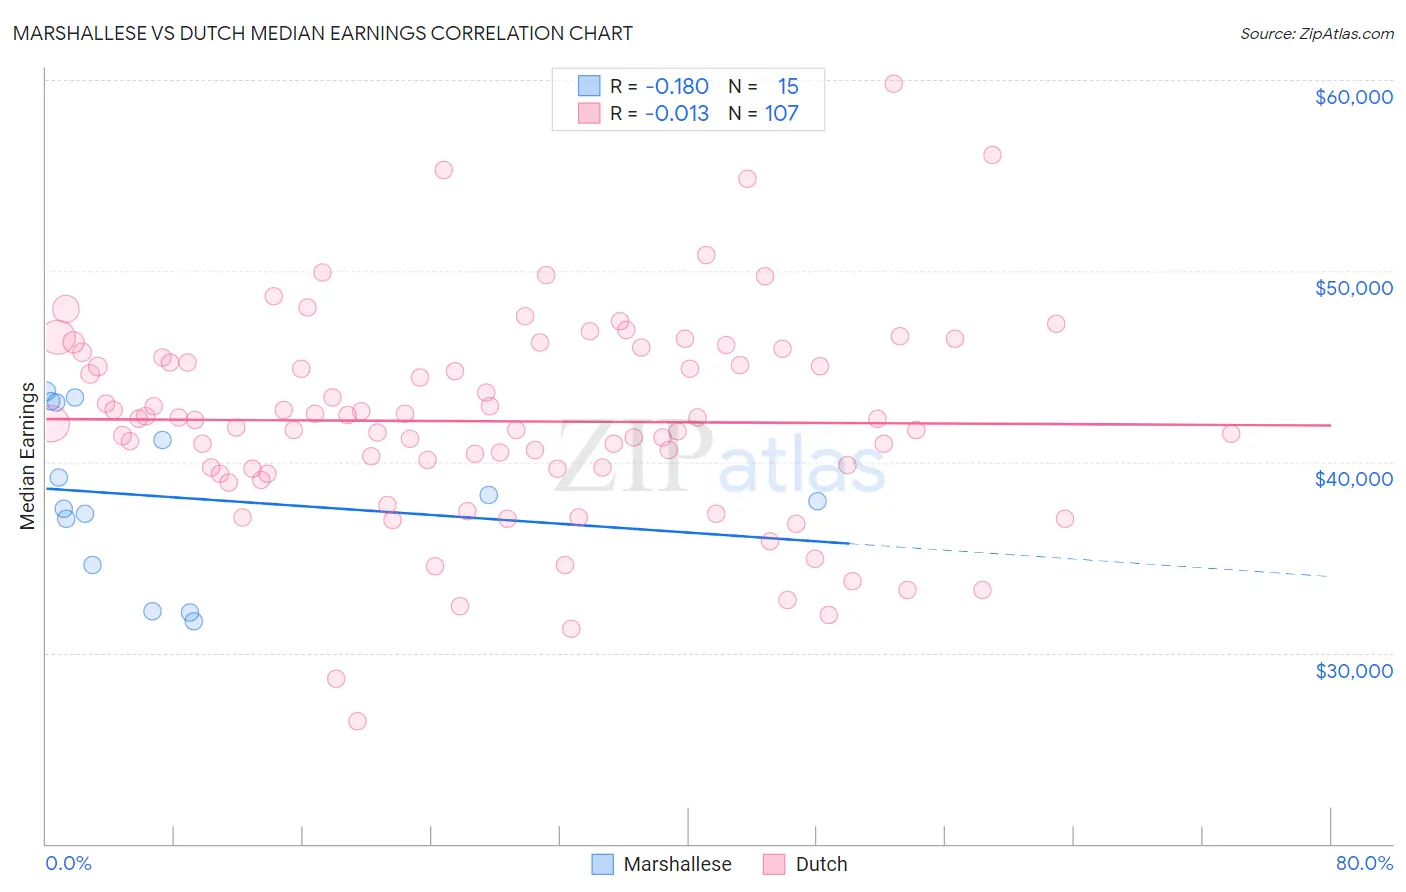
Marshallese vs Dutch Median Earnings Correlation Chart
The statistical analysis conducted on geographies consisting of 14,760,991 people shows a poor negative correlation between the proportion of Marshallese and median earnings in the United States with a correlation coefficient (R) of -0.180 and weighted average of $41,969. Similarly, the statistical analysis conducted on geographies consisting of 554,077,686 people shows no correlation between the proportion of Dutch and median earnings in the United States with a correlation coefficient (R) of -0.013 and weighted average of $45,370, a difference of 8.1%.
Median Earnings Correlation Summary
| Measurement | Marshallese | Dutch |
| Minimum | $31,625 | $26,401 |
| Maximum | $43,685 | $59,776 |
| Range | $12,060 | $33,374 |
| Mean | $38,147 | $42,124 |
| Median | $37,917 | $42,201 |
| Interquartile 25% (IQ1) | $34,587 | $39,612 |
| Interquartile 75% (IQ3) | $43,141 | $45,450 |
| Interquartile Range (IQR) | $8,554 | $5,838 |
| Standard Deviation (Sample) | $4,207 | $5,476 |
| Standard Deviation (Population) | $4,065 | $5,450 |
Similar Demographics by Median Earnings
Demographics Similar to Marshallese by Median Earnings
In terms of median earnings, the demographic groups most similar to Marshallese are African ($41,955, a difference of 0.030%), Dominican ($41,864, a difference of 0.25%), Hmong ($42,111, a difference of 0.34%), Blackfeet ($41,822, a difference of 0.35%), and Colville ($42,151, a difference of 0.43%).
| Demographics | Rating | Rank | Median Earnings |
| Immigrants | El Salvador | 0.4 /100 | #274 | Tragic $42,413 |
| Immigrants | Belize | 0.3 /100 | #275 | Tragic $42,339 |
| Spanish Americans | 0.3 /100 | #276 | Tragic $42,316 |
| Central Americans | 0.3 /100 | #277 | Tragic $42,280 |
| Cajuns | 0.3 /100 | #278 | Tragic $42,189 |
| Colville | 0.2 /100 | #279 | Tragic $42,151 |
| Hmong | 0.2 /100 | #280 | Tragic $42,111 |
| Marshallese | 0.2 /100 | #281 | Tragic $41,969 |
| Africans | 0.2 /100 | #282 | Tragic $41,955 |
| Dominicans | 0.2 /100 | #283 | Tragic $41,864 |
| Blackfeet | 0.2 /100 | #284 | Tragic $41,822 |
| Immigrants | Nicaragua | 0.1 /100 | #285 | Tragic $41,737 |
| Mexican American Indians | 0.1 /100 | #286 | Tragic $41,719 |
| Indonesians | 0.1 /100 | #287 | Tragic $41,701 |
| Immigrants | Dominican Republic | 0.1 /100 | #288 | Tragic $41,554 |
Demographics Similar to Dutch by Median Earnings
In terms of median earnings, the demographic groups most similar to Dutch are Spanish ($45,432, a difference of 0.14%), Guyanese ($45,470, a difference of 0.22%), Tlingit-Haida ($45,468, a difference of 0.22%), Ecuadorian ($45,214, a difference of 0.35%), and Nigerian ($45,532, a difference of 0.36%).
| Demographics | Rating | Rank | Median Earnings |
| Bermudans | 23.5 /100 | #212 | Fair $45,593 |
| Immigrants | Colombia | 22.4 /100 | #213 | Fair $45,550 |
| Nigerians | 22.0 /100 | #214 | Fair $45,532 |
| Immigrants | Bangladesh | 22.0 /100 | #215 | Fair $45,532 |
| Guyanese | 20.6 /100 | #216 | Fair $45,470 |
| Tlingit-Haida | 20.5 /100 | #217 | Fair $45,468 |
| Spanish | 19.7 /100 | #218 | Poor $45,432 |
| Dutch | 18.4 /100 | #219 | Poor $45,370 |
| Ecuadorians | 15.3 /100 | #220 | Poor $45,214 |
| Immigrants | Guyana | 15.1 /100 | #221 | Poor $45,204 |
| Immigrants | Panama | 15.0 /100 | #222 | Poor $45,198 |
| Whites/Caucasians | 15.0 /100 | #223 | Poor $45,197 |
| West Indians | 13.9 /100 | #224 | Poor $45,132 |
| Immigrants | Cambodia | 13.2 /100 | #225 | Poor $45,090 |
| Immigrants | Nigeria | 12.2 /100 | #226 | Poor $45,030 |