Marshallese vs Estonian Median Earnings
COMPARE
Marshallese
Estonian
Median Earnings
Median Earnings Comparison
Marshallese
Estonians
$41,969
MEDIAN EARNINGS
0.2/ 100
METRIC RATING
281st/ 347
METRIC RANK
$51,772
MEDIAN EARNINGS
99.9/ 100
METRIC RATING
52nd/ 347
METRIC RANK
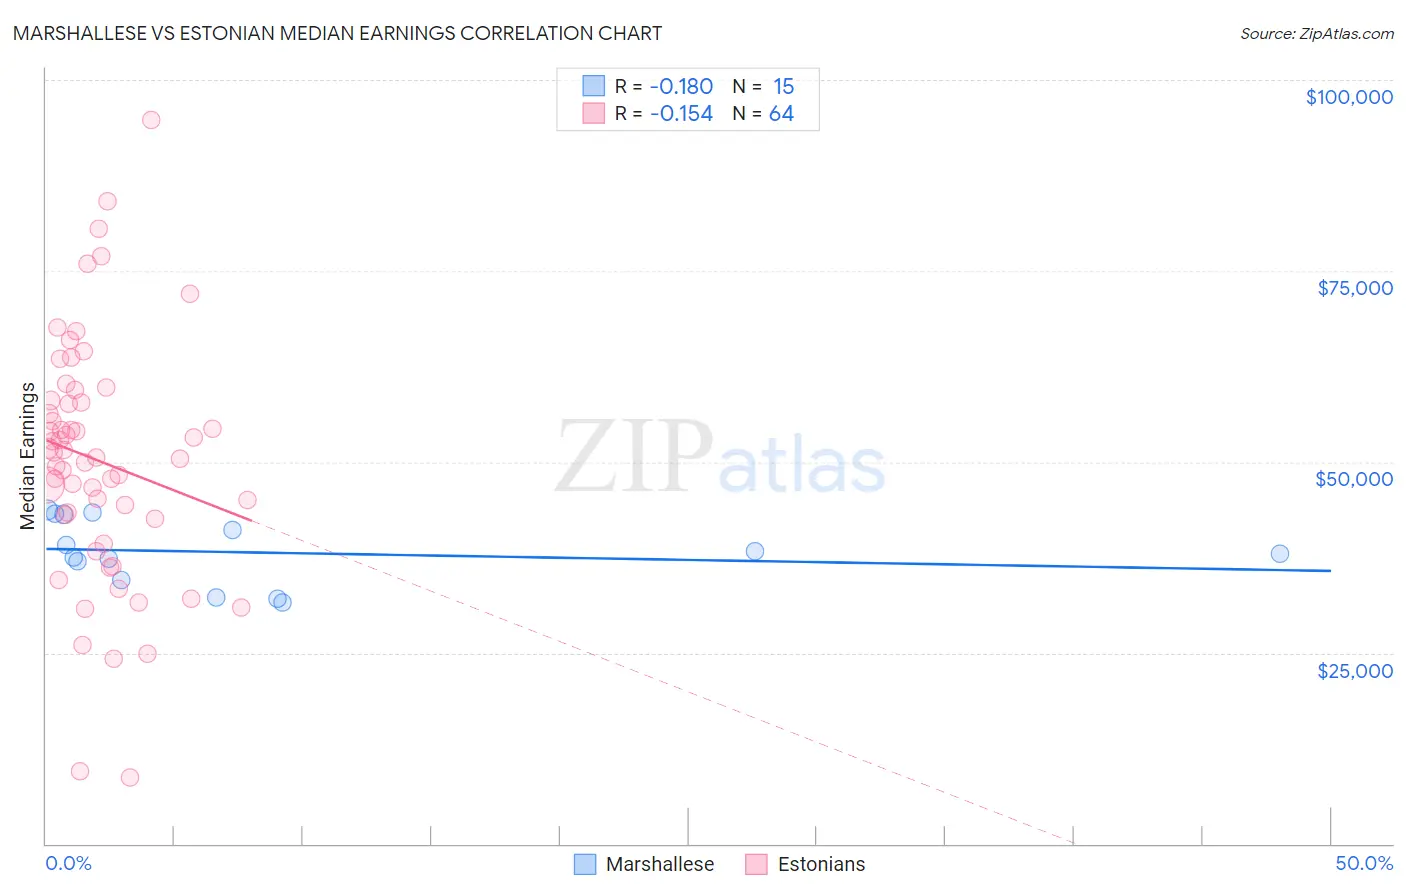
Marshallese vs Estonian Median Earnings Correlation Chart
The statistical analysis conducted on geographies consisting of 14,760,991 people shows a poor negative correlation between the proportion of Marshallese and median earnings in the United States with a correlation coefficient (R) of -0.180 and weighted average of $41,969. Similarly, the statistical analysis conducted on geographies consisting of 123,525,631 people shows a poor negative correlation between the proportion of Estonians and median earnings in the United States with a correlation coefficient (R) of -0.154 and weighted average of $51,772, a difference of 23.4%.
Median Earnings Correlation Summary
| Measurement | Marshallese | Estonian |
| Minimum | $31,625 | $8,672 |
| Maximum | $43,685 | $94,792 |
| Range | $12,060 | $86,120 |
| Mean | $38,147 | $50,194 |
| Median | $37,917 | $50,958 |
| Interquartile 25% (IQ1) | $34,587 | $42,740 |
| Interquartile 75% (IQ3) | $43,141 | $57,865 |
| Interquartile Range (IQR) | $8,554 | $15,125 |
| Standard Deviation (Sample) | $4,207 | $15,990 |
| Standard Deviation (Population) | $4,065 | $15,865 |
Similar Demographics by Median Earnings
Demographics Similar to Marshallese by Median Earnings
In terms of median earnings, the demographic groups most similar to Marshallese are African ($41,955, a difference of 0.030%), Dominican ($41,864, a difference of 0.25%), Hmong ($42,111, a difference of 0.34%), Blackfeet ($41,822, a difference of 0.35%), and Colville ($42,151, a difference of 0.43%).
| Demographics | Rating | Rank | Median Earnings |
| Immigrants | El Salvador | 0.4 /100 | #274 | Tragic $42,413 |
| Immigrants | Belize | 0.3 /100 | #275 | Tragic $42,339 |
| Spanish Americans | 0.3 /100 | #276 | Tragic $42,316 |
| Central Americans | 0.3 /100 | #277 | Tragic $42,280 |
| Cajuns | 0.3 /100 | #278 | Tragic $42,189 |
| Colville | 0.2 /100 | #279 | Tragic $42,151 |
| Hmong | 0.2 /100 | #280 | Tragic $42,111 |
| Marshallese | 0.2 /100 | #281 | Tragic $41,969 |
| Africans | 0.2 /100 | #282 | Tragic $41,955 |
| Dominicans | 0.2 /100 | #283 | Tragic $41,864 |
| Blackfeet | 0.2 /100 | #284 | Tragic $41,822 |
| Immigrants | Nicaragua | 0.1 /100 | #285 | Tragic $41,737 |
| Mexican American Indians | 0.1 /100 | #286 | Tragic $41,719 |
| Indonesians | 0.1 /100 | #287 | Tragic $41,701 |
| Immigrants | Dominican Republic | 0.1 /100 | #288 | Tragic $41,554 |
Demographics Similar to Estonians by Median Earnings
In terms of median earnings, the demographic groups most similar to Estonians are Immigrants from Norway ($51,758, a difference of 0.030%), Immigrants from Austria ($51,826, a difference of 0.10%), Immigrants from Indonesia ($51,715, a difference of 0.11%), Egyptian ($51,701, a difference of 0.14%), and Immigrants from South Africa ($51,850, a difference of 0.15%).
| Demographics | Rating | Rank | Median Earnings |
| Immigrants | Czechoslovakia | 100.0 /100 | #45 | Exceptional $52,361 |
| Bhutanese | 100.0 /100 | #46 | Exceptional $52,297 |
| Australians | 100.0 /100 | #47 | Exceptional $52,294 |
| Immigrants | Europe | 100.0 /100 | #48 | Exceptional $52,195 |
| Bolivians | 100.0 /100 | #49 | Exceptional $52,005 |
| Immigrants | South Africa | 100.0 /100 | #50 | Exceptional $51,850 |
| Immigrants | Austria | 99.9 /100 | #51 | Exceptional $51,826 |
| Estonians | 99.9 /100 | #52 | Exceptional $51,772 |
| Immigrants | Norway | 99.9 /100 | #53 | Exceptional $51,758 |
| Immigrants | Indonesia | 99.9 /100 | #54 | Exceptional $51,715 |
| Egyptians | 99.9 /100 | #55 | Exceptional $51,701 |
| Immigrants | Pakistan | 99.9 /100 | #56 | Exceptional $51,693 |
| Immigrants | Eastern Europe | 99.9 /100 | #57 | Exceptional $51,624 |
| Immigrants | Bolivia | 99.9 /100 | #58 | Exceptional $51,605 |
| Immigrants | Croatia | 99.9 /100 | #59 | Exceptional $51,581 |