Marshallese vs Navajo Median Earnings
COMPARE
Marshallese
Navajo
Median Earnings
Median Earnings Comparison
Marshallese
Navajo
$41,969
MEDIAN EARNINGS
0.2/ 100
METRIC RATING
281st/ 347
METRIC RANK
$36,999
MEDIAN EARNINGS
0.0/ 100
METRIC RATING
340th/ 347
METRIC RANK
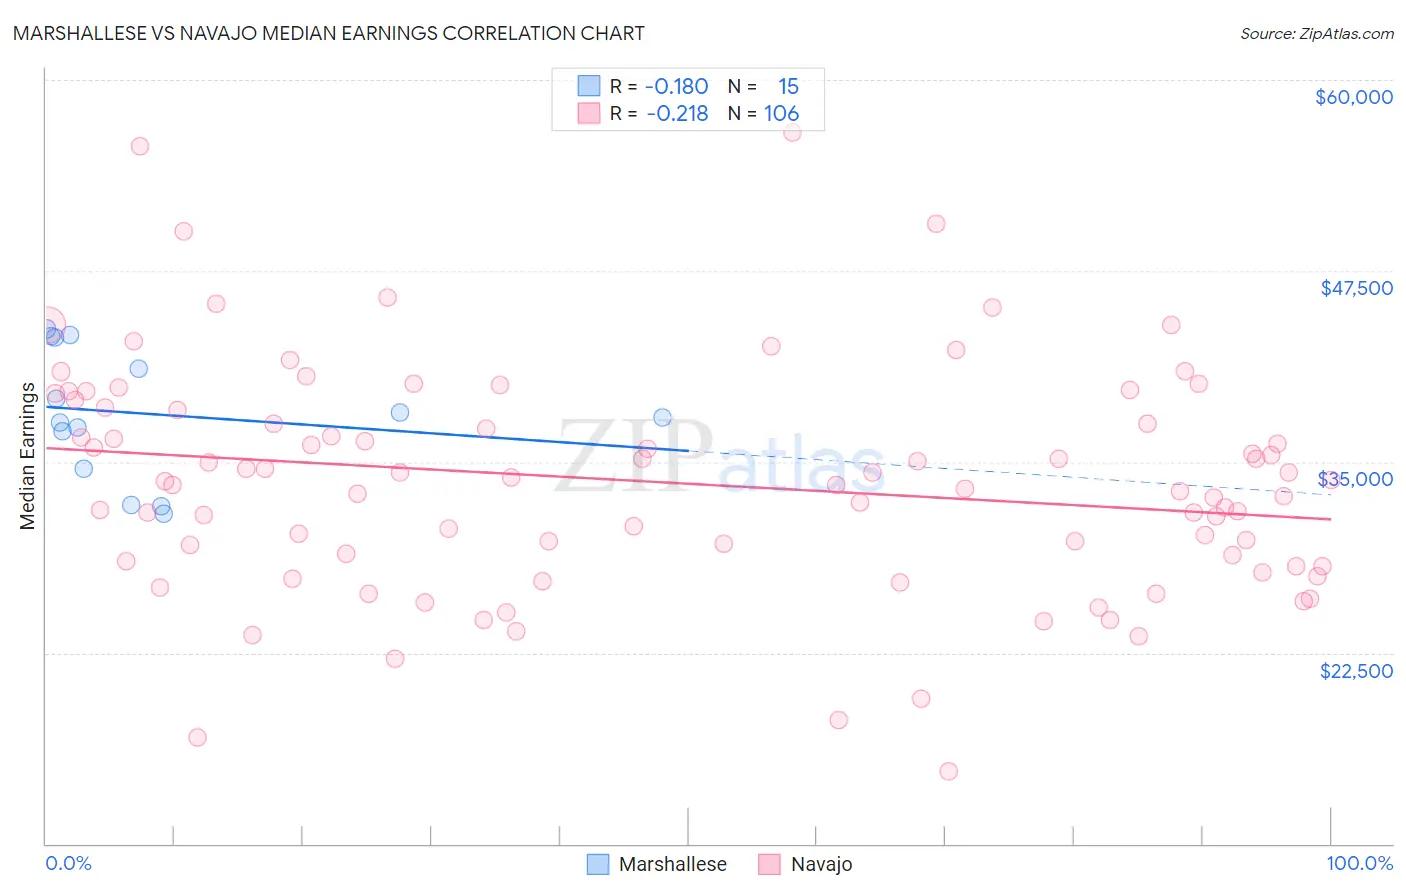
Marshallese vs Navajo Median Earnings Correlation Chart
The statistical analysis conducted on geographies consisting of 14,760,991 people shows a poor negative correlation between the proportion of Marshallese and median earnings in the United States with a correlation coefficient (R) of -0.180 and weighted average of $41,969. Similarly, the statistical analysis conducted on geographies consisting of 224,830,448 people shows a weak negative correlation between the proportion of Navajo and median earnings in the United States with a correlation coefficient (R) of -0.218 and weighted average of $36,999, a difference of 13.4%.
Median Earnings Correlation Summary
| Measurement | Marshallese | Navajo |
| Minimum | $31,625 | $14,775 |
| Maximum | $43,685 | $56,536 |
| Range | $12,060 | $41,761 |
| Mean | $38,147 | $33,645 |
| Median | $37,917 | $33,604 |
| Interquartile 25% (IQ1) | $34,587 | $28,471 |
| Interquartile 75% (IQ3) | $43,141 | $38,362 |
| Interquartile Range (IQR) | $8,554 | $9,890 |
| Standard Deviation (Sample) | $4,207 | $7,461 |
| Standard Deviation (Population) | $4,065 | $7,426 |
Similar Demographics by Median Earnings
Demographics Similar to Marshallese by Median Earnings
In terms of median earnings, the demographic groups most similar to Marshallese are African ($41,955, a difference of 0.030%), Dominican ($41,864, a difference of 0.25%), Hmong ($42,111, a difference of 0.34%), Blackfeet ($41,822, a difference of 0.35%), and Colville ($42,151, a difference of 0.43%).
| Demographics | Rating | Rank | Median Earnings |
| Immigrants | El Salvador | 0.4 /100 | #274 | Tragic $42,413 |
| Immigrants | Belize | 0.3 /100 | #275 | Tragic $42,339 |
| Spanish Americans | 0.3 /100 | #276 | Tragic $42,316 |
| Central Americans | 0.3 /100 | #277 | Tragic $42,280 |
| Cajuns | 0.3 /100 | #278 | Tragic $42,189 |
| Colville | 0.2 /100 | #279 | Tragic $42,151 |
| Hmong | 0.2 /100 | #280 | Tragic $42,111 |
| Marshallese | 0.2 /100 | #281 | Tragic $41,969 |
| Africans | 0.2 /100 | #282 | Tragic $41,955 |
| Dominicans | 0.2 /100 | #283 | Tragic $41,864 |
| Blackfeet | 0.2 /100 | #284 | Tragic $41,822 |
| Immigrants | Nicaragua | 0.1 /100 | #285 | Tragic $41,737 |
| Mexican American Indians | 0.1 /100 | #286 | Tragic $41,719 |
| Indonesians | 0.1 /100 | #287 | Tragic $41,701 |
| Immigrants | Dominican Republic | 0.1 /100 | #288 | Tragic $41,554 |
Demographics Similar to Navajo by Median Earnings
In terms of median earnings, the demographic groups most similar to Navajo are Lumbee ($36,876, a difference of 0.33%), Hopi ($36,871, a difference of 0.35%), Pueblo ($36,859, a difference of 0.38%), Arapaho ($36,586, a difference of 1.1%), and Tohono O'odham ($36,349, a difference of 1.8%).
| Demographics | Rating | Rank | Median Earnings |
| Houma | 0.0 /100 | #333 | Tragic $38,949 |
| Spanish American Indians | 0.0 /100 | #334 | Tragic $38,907 |
| Natives/Alaskans | 0.0 /100 | #335 | Tragic $38,896 |
| Crow | 0.0 /100 | #336 | Tragic $38,707 |
| Immigrants | Cuba | 0.0 /100 | #337 | Tragic $38,426 |
| Pima | 0.0 /100 | #338 | Tragic $38,285 |
| Menominee | 0.0 /100 | #339 | Tragic $37,884 |
| Navajo | 0.0 /100 | #340 | Tragic $36,999 |
| Lumbee | 0.0 /100 | #341 | Tragic $36,876 |
| Hopi | 0.0 /100 | #342 | Tragic $36,871 |
| Pueblo | 0.0 /100 | #343 | Tragic $36,859 |
| Arapaho | 0.0 /100 | #344 | Tragic $36,586 |
| Tohono O'odham | 0.0 /100 | #345 | Tragic $36,349 |
| Yup'ik | 0.0 /100 | #346 | Tragic $35,942 |
| Puerto Ricans | 0.0 /100 | #347 | Tragic $35,560 |