Scottish vs Peruvian Median Female Earnings
COMPARE
Scottish
Peruvian
Median Female Earnings
Median Female Earnings Comparison
Scottish
Peruvians
$38,397
MEDIAN FEMALE EARNINGS
6.3/ 100
METRIC RATING
227th/ 347
METRIC RANK
$40,234
MEDIAN FEMALE EARNINGS
75.3/ 100
METRIC RATING
156th/ 347
METRIC RANK
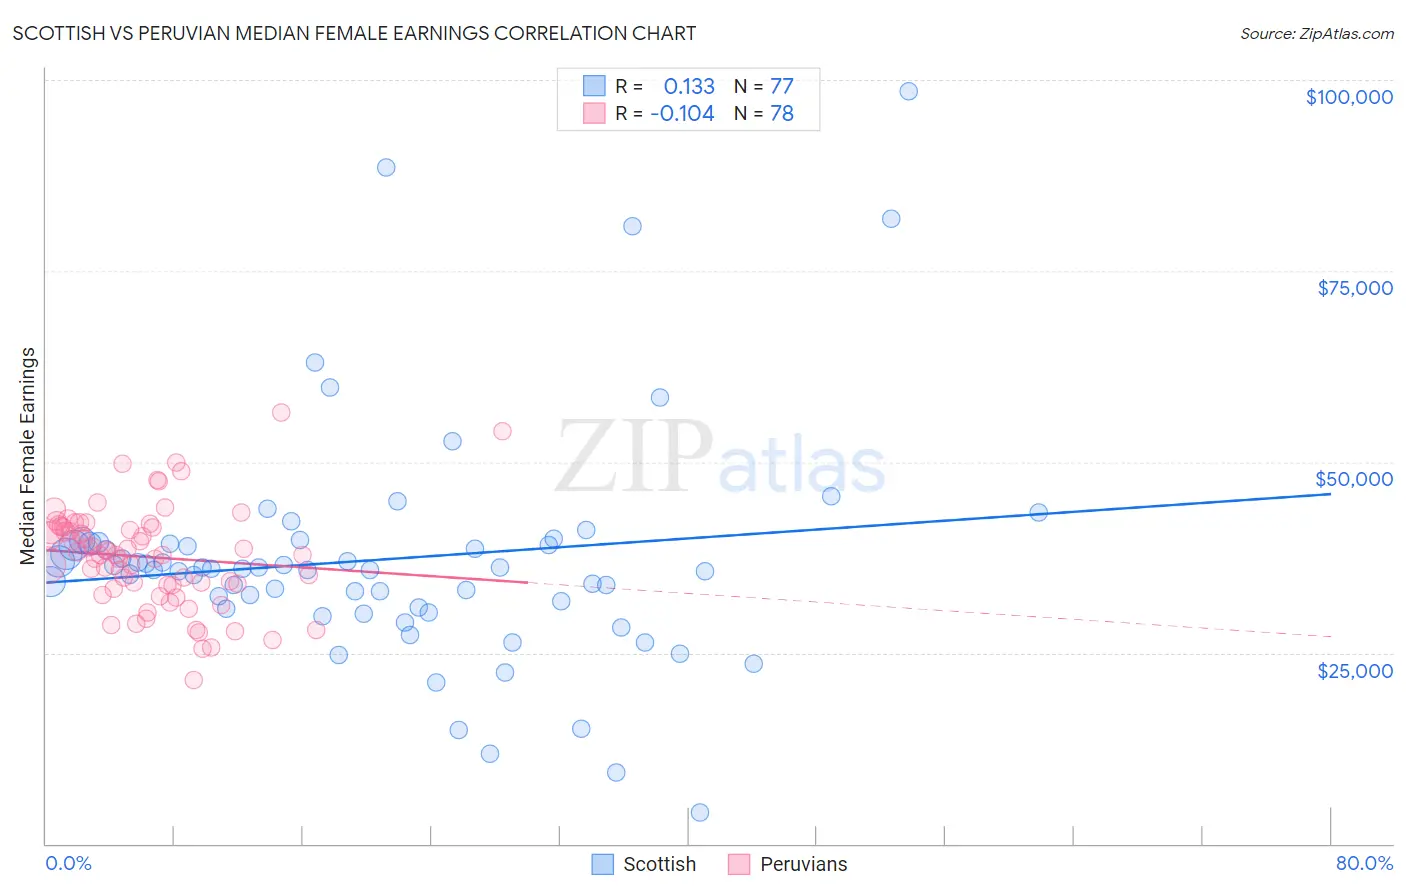
Scottish vs Peruvian Median Female Earnings Correlation Chart
The statistical analysis conducted on geographies consisting of 565,316,168 people shows a poor positive correlation between the proportion of Scottish and median female earnings in the United States with a correlation coefficient (R) of 0.133 and weighted average of $38,397. Similarly, the statistical analysis conducted on geographies consisting of 363,169,099 people shows a poor negative correlation between the proportion of Peruvians and median female earnings in the United States with a correlation coefficient (R) of -0.104 and weighted average of $40,234, a difference of 4.8%.
Median Female Earnings Correlation Summary
| Measurement | Scottish | Peruvian |
| Minimum | $4,115 | $21,456 |
| Maximum | $98,472 | $56,528 |
| Range | $94,357 | $35,072 |
| Mean | $37,218 | $37,547 |
| Median | $35,990 | $37,836 |
| Interquartile 25% (IQ1) | $30,914 | $33,920 |
| Interquartile 75% (IQ3) | $39,333 | $41,414 |
| Interquartile Range (IQR) | $8,419 | $7,494 |
| Standard Deviation (Sample) | $15,319 | $6,584 |
| Standard Deviation (Population) | $15,219 | $6,542 |
Similar Demographics by Median Female Earnings
Demographics Similar to Scottish by Median Female Earnings
In terms of median female earnings, the demographic groups most similar to Scottish are Subsaharan African ($38,391, a difference of 0.020%), Belgian ($38,382, a difference of 0.040%), French Canadian ($38,436, a difference of 0.10%), Basque ($38,352, a difference of 0.12%), and French ($38,457, a difference of 0.15%).
| Demographics | Rating | Rank | Median Female Earnings |
| Yugoslavians | 8.8 /100 | #220 | Tragic $38,573 |
| Immigrants | Azores | 8.8 /100 | #221 | Tragic $38,573 |
| Japanese | 8.1 /100 | #222 | Tragic $38,528 |
| Immigrants | Sudan | 7.8 /100 | #223 | Tragic $38,511 |
| Native Hawaiians | 7.1 /100 | #224 | Tragic $38,461 |
| French | 7.0 /100 | #225 | Tragic $38,457 |
| French Canadians | 6.8 /100 | #226 | Tragic $38,436 |
| Scottish | 6.3 /100 | #227 | Tragic $38,397 |
| Sub-Saharan Africans | 6.2 /100 | #228 | Tragic $38,391 |
| Belgians | 6.1 /100 | #229 | Tragic $38,382 |
| Basques | 5.7 /100 | #230 | Tragic $38,352 |
| Somalis | 5.5 /100 | #231 | Tragic $38,333 |
| Scandinavians | 5.2 /100 | #232 | Tragic $38,306 |
| Tongans | 5.1 /100 | #233 | Tragic $38,288 |
| Celtics | 5.0 /100 | #234 | Tragic $38,283 |
Demographics Similar to Peruvians by Median Female Earnings
In terms of median female earnings, the demographic groups most similar to Peruvians are Immigrants from Africa ($40,257, a difference of 0.060%), Portuguese ($40,177, a difference of 0.14%), British West Indian ($40,299, a difference of 0.16%), Immigrants from Oceania ($40,297, a difference of 0.16%), and Immigrants from Senegal ($40,157, a difference of 0.19%).
| Demographics | Rating | Rank | Median Female Earnings |
| Immigrants | Cameroon | 79.7 /100 | #149 | Good $40,354 |
| Immigrants | Chile | 79.6 /100 | #150 | Good $40,353 |
| Immigrants | Armenia | 79.2 /100 | #151 | Good $40,340 |
| West Indians | 78.4 /100 | #152 | Good $40,317 |
| British West Indians | 77.7 /100 | #153 | Good $40,299 |
| Immigrants | Oceania | 77.6 /100 | #154 | Good $40,297 |
| Immigrants | Africa | 76.2 /100 | #155 | Good $40,257 |
| Peruvians | 75.3 /100 | #156 | Good $40,234 |
| Portuguese | 73.0 /100 | #157 | Good $40,177 |
| Immigrants | Senegal | 72.2 /100 | #158 | Good $40,157 |
| Immigrants | Vietnam | 72.0 /100 | #159 | Good $40,153 |
| Inupiat | 68.9 /100 | #160 | Good $40,080 |
| Alsatians | 68.0 /100 | #161 | Good $40,060 |
| South American Indians | 66.1 /100 | #162 | Good $40,019 |
| Lebanese | 65.5 /100 | #163 | Good $40,006 |