Taiwanese vs Peruvian Median Female Earnings
COMPARE
Taiwanese
Peruvian
Median Female Earnings
Median Female Earnings Comparison
Taiwanese
Peruvians
$40,576
MEDIAN FEMALE EARNINGS
86.1/ 100
METRIC RATING
138th/ 347
METRIC RANK
$40,234
MEDIAN FEMALE EARNINGS
75.3/ 100
METRIC RATING
156th/ 347
METRIC RANK
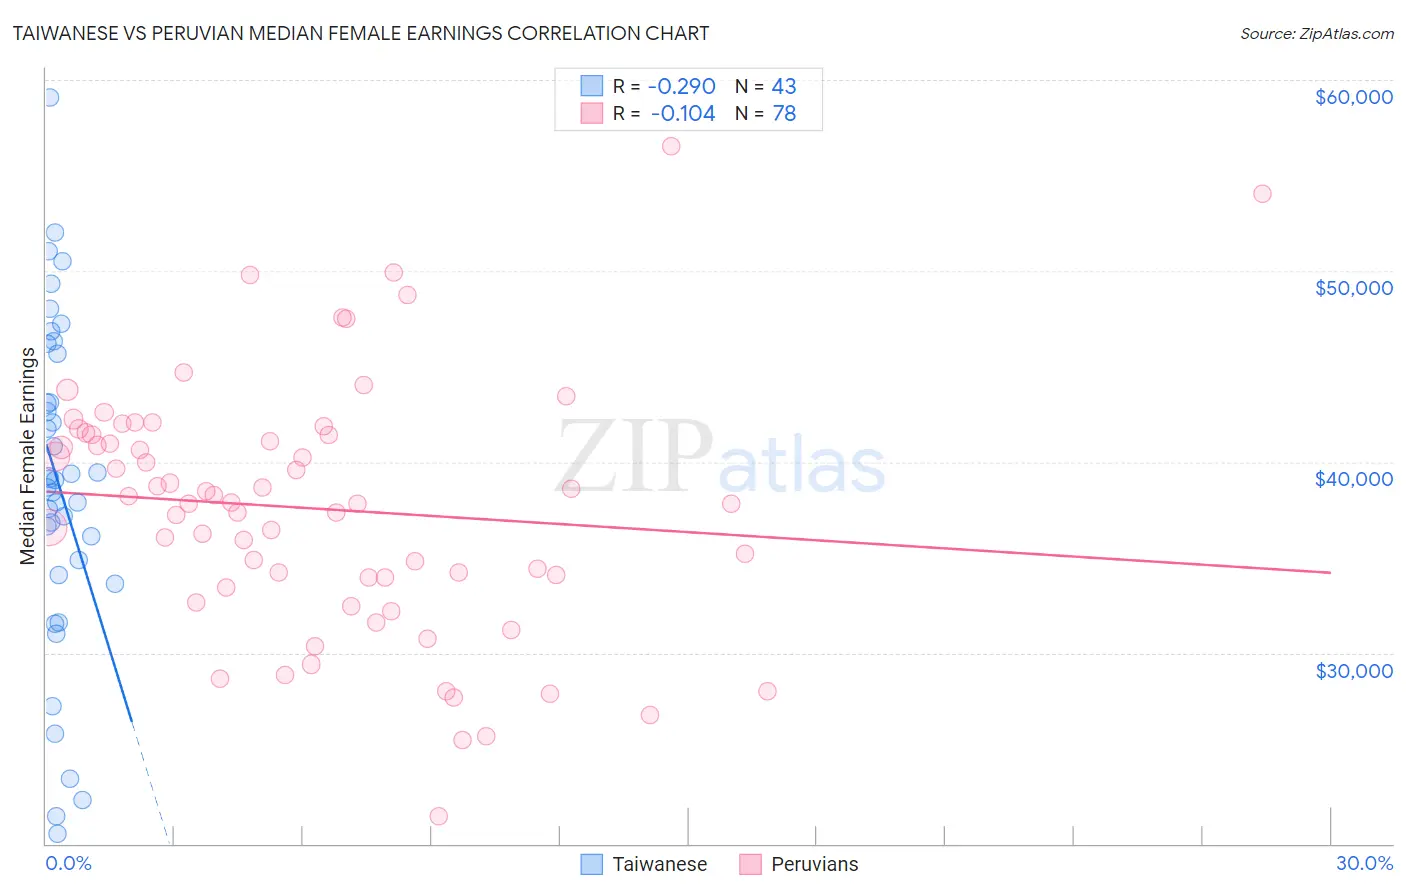
Taiwanese vs Peruvian Median Female Earnings Correlation Chart
The statistical analysis conducted on geographies consisting of 31,721,885 people shows a weak negative correlation between the proportion of Taiwanese and median female earnings in the United States with a correlation coefficient (R) of -0.290 and weighted average of $40,576. Similarly, the statistical analysis conducted on geographies consisting of 363,169,099 people shows a poor negative correlation between the proportion of Peruvians and median female earnings in the United States with a correlation coefficient (R) of -0.104 and weighted average of $40,234, a difference of 0.85%.
Median Female Earnings Correlation Summary
| Measurement | Taiwanese | Peruvian |
| Minimum | $20,555 | $21,456 |
| Maximum | $59,093 | $56,528 |
| Range | $38,538 | $35,072 |
| Mean | $38,751 | $37,547 |
| Median | $39,019 | $37,836 |
| Interquartile 25% (IQ1) | $34,095 | $33,920 |
| Interquartile 75% (IQ3) | $45,655 | $41,414 |
| Interquartile Range (IQR) | $11,560 | $7,494 |
| Standard Deviation (Sample) | $8,643 | $6,584 |
| Standard Deviation (Population) | $8,542 | $6,542 |
Demographics Similar to Taiwanese and Peruvians by Median Female Earnings
In terms of median female earnings, the demographic groups most similar to Taiwanese are Immigrants from South Eastern Asia ($40,558, a difference of 0.040%), Pakistani ($40,596, a difference of 0.050%), Serbian ($40,539, a difference of 0.090%), Immigrants from Syria ($40,499, a difference of 0.19%), and Sri Lankan ($40,496, a difference of 0.20%). Similarly, the demographic groups most similar to Peruvians are Immigrants from Africa ($40,257, a difference of 0.060%), Portuguese ($40,177, a difference of 0.14%), British West Indian ($40,299, a difference of 0.16%), Immigrants from Oceania ($40,297, a difference of 0.16%), and West Indian ($40,317, a difference of 0.20%).
| Demographics | Rating | Rank | Median Female Earnings |
| Pakistanis | 86.6 /100 | #137 | Excellent $40,596 |
| Taiwanese | 86.1 /100 | #138 | Excellent $40,576 |
| Immigrants | South Eastern Asia | 85.7 /100 | #139 | Excellent $40,558 |
| Serbians | 85.2 /100 | #140 | Excellent $40,539 |
| Immigrants | Syria | 84.1 /100 | #141 | Excellent $40,499 |
| Sri Lankans | 84.0 /100 | #142 | Excellent $40,496 |
| Northern Europeans | 83.9 /100 | #143 | Excellent $40,491 |
| Immigrants | North Macedonia | 83.8 /100 | #144 | Excellent $40,488 |
| Brazilians | 83.6 /100 | #145 | Excellent $40,483 |
| Ghanaians | 82.1 /100 | #146 | Excellent $40,429 |
| Vietnamese | 80.4 /100 | #147 | Excellent $40,377 |
| Poles | 80.2 /100 | #148 | Excellent $40,371 |
| Immigrants | Cameroon | 79.7 /100 | #149 | Good $40,354 |
| Immigrants | Chile | 79.6 /100 | #150 | Good $40,353 |
| Immigrants | Armenia | 79.2 /100 | #151 | Good $40,340 |
| West Indians | 78.4 /100 | #152 | Good $40,317 |
| British West Indians | 77.7 /100 | #153 | Good $40,299 |
| Immigrants | Oceania | 77.6 /100 | #154 | Good $40,297 |
| Immigrants | Africa | 76.2 /100 | #155 | Good $40,257 |
| Peruvians | 75.3 /100 | #156 | Good $40,234 |
| Portuguese | 73.0 /100 | #157 | Good $40,177 |