Malaysian vs Pima Per Capita Income
COMPARE
Malaysian
Pima
Per Capita Income
Per Capita Income Comparison
Malaysians
Pima
$39,194
PER CAPITA INCOME
0.7/ 100
METRIC RATING
259th/ 347
METRIC RANK
$30,644
PER CAPITA INCOME
0.0/ 100
METRIC RATING
343rd/ 347
METRIC RANK
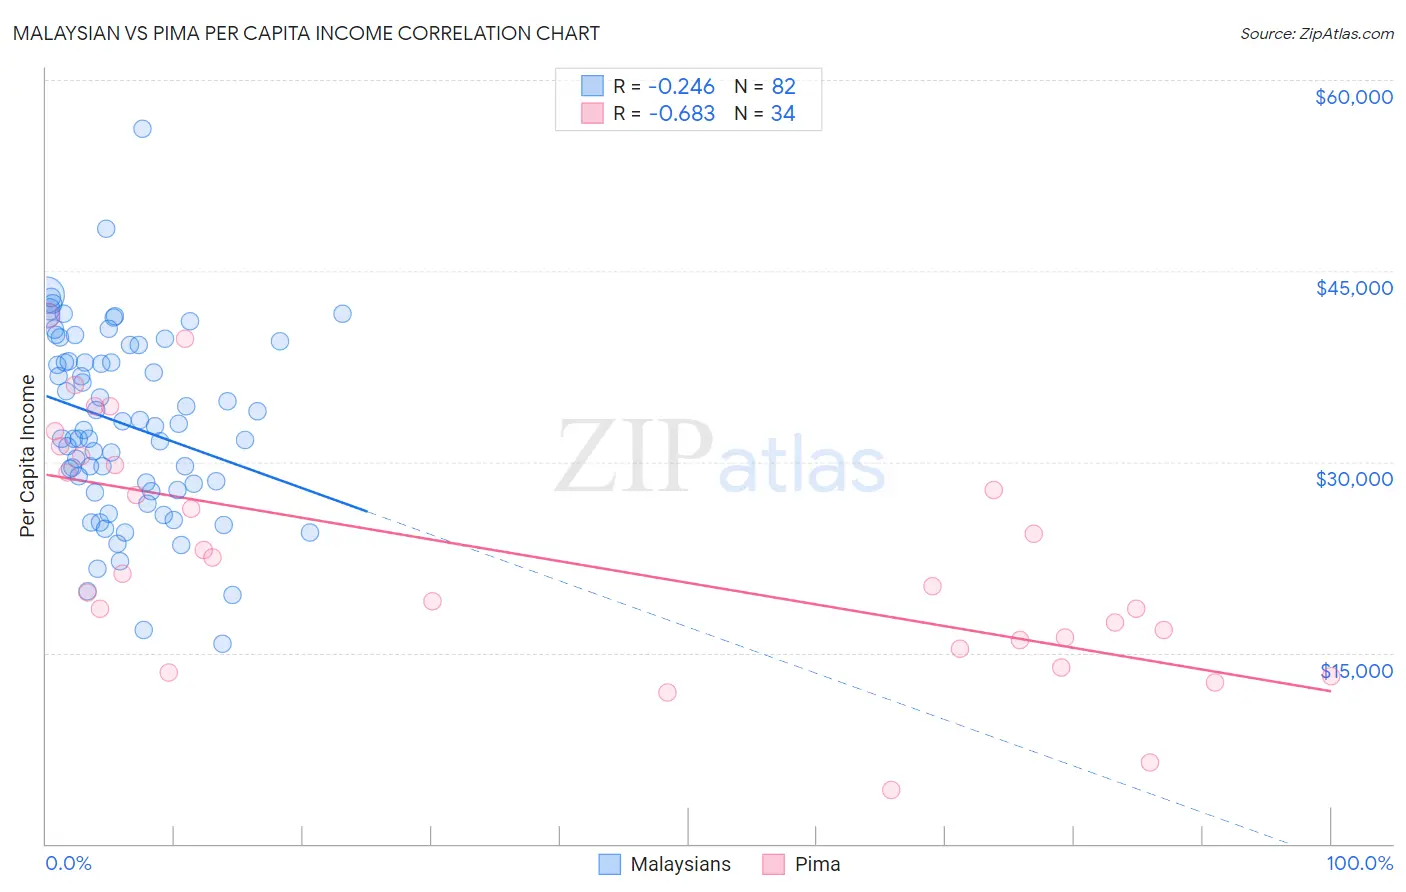
Malaysian vs Pima Per Capita Income Correlation Chart
The statistical analysis conducted on geographies consisting of 226,115,655 people shows a weak negative correlation between the proportion of Malaysians and per capita income in the United States with a correlation coefficient (R) of -0.246 and weighted average of $39,194. Similarly, the statistical analysis conducted on geographies consisting of 61,552,682 people shows a significant negative correlation between the proportion of Pima and per capita income in the United States with a correlation coefficient (R) of -0.683 and weighted average of $30,644, a difference of 27.9%.
Per Capita Income Correlation Summary
| Measurement | Malaysian | Pima |
| Minimum | $15,753 | $4,256 |
| Maximum | $56,163 | $41,474 |
| Range | $40,410 | $37,218 |
| Mean | $32,947 | $22,491 |
| Median | $32,625 | $20,723 |
| Interquartile 25% (IQ1) | $27,821 | $16,036 |
| Interquartile 75% (IQ3) | $39,160 | $29,725 |
| Interquartile Range (IQR) | $11,339 | $13,689 |
| Standard Deviation (Sample) | $7,360 | $9,246 |
| Standard Deviation (Population) | $7,315 | $9,109 |
Similar Demographics by Per Capita Income
Demographics Similar to Malaysians by Per Capita Income
In terms of per capita income, the demographic groups most similar to Malaysians are Alaskan Athabascan ($39,163, a difference of 0.080%), Jamaican ($39,231, a difference of 0.090%), Marshallese ($39,108, a difference of 0.22%), Iroquois ($39,104, a difference of 0.23%), and Belizean ($39,097, a difference of 0.25%).
| Demographics | Rating | Rank | Per Capita Income |
| Immigrants | Azores | 1.0 /100 | #252 | Tragic $39,608 |
| Osage | 1.0 /100 | #253 | Tragic $39,568 |
| Alaska Natives | 1.0 /100 | #254 | Tragic $39,558 |
| Immigrants | Middle Africa | 1.0 /100 | #255 | Tragic $39,529 |
| Hawaiians | 0.8 /100 | #256 | Tragic $39,403 |
| Nicaraguans | 0.8 /100 | #257 | Tragic $39,372 |
| Jamaicans | 0.7 /100 | #258 | Tragic $39,231 |
| Malaysians | 0.7 /100 | #259 | Tragic $39,194 |
| Alaskan Athabascans | 0.6 /100 | #260 | Tragic $39,163 |
| Marshallese | 0.6 /100 | #261 | Tragic $39,108 |
| Iroquois | 0.6 /100 | #262 | Tragic $39,104 |
| Belizeans | 0.6 /100 | #263 | Tragic $39,097 |
| Americans | 0.6 /100 | #264 | Tragic $39,039 |
| Spanish Americans | 0.5 /100 | #265 | Tragic $39,012 |
| Salvadorans | 0.5 /100 | #266 | Tragic $38,858 |
Demographics Similar to Pima by Per Capita Income
In terms of per capita income, the demographic groups most similar to Pima are Yup'ik ($30,518, a difference of 0.41%), Tohono O'odham ($30,256, a difference of 1.3%), Hopi ($31,177, a difference of 1.7%), Puerto Rican ($31,268, a difference of 2.0%), and Lumbee ($29,845, a difference of 2.7%).
| Demographics | Rating | Rank | Per Capita Income |
| Immigrants | Yemen | 0.0 /100 | #333 | Tragic $33,696 |
| Natives/Alaskans | 0.0 /100 | #334 | Tragic $33,279 |
| Yuman | 0.0 /100 | #335 | Tragic $33,236 |
| Yakama | 0.0 /100 | #336 | Tragic $33,009 |
| Houma | 0.0 /100 | #337 | Tragic $32,996 |
| Arapaho | 0.0 /100 | #338 | Tragic $32,345 |
| Pueblo | 0.0 /100 | #339 | Tragic $32,012 |
| Crow | 0.0 /100 | #340 | Tragic $31,729 |
| Puerto Ricans | 0.0 /100 | #341 | Tragic $31,268 |
| Hopi | 0.0 /100 | #342 | Tragic $31,177 |
| Pima | 0.0 /100 | #343 | Tragic $30,644 |
| Yup'ik | 0.0 /100 | #344 | Tragic $30,518 |
| Tohono O'odham | 0.0 /100 | #345 | Tragic $30,256 |
| Lumbee | 0.0 /100 | #346 | Tragic $29,845 |
| Navajo | 0.0 /100 | #347 | Tragic $29,031 |