Malaysian vs Immigrants from Australia Per Capita Income
COMPARE
Malaysian
Immigrants from Australia
Per Capita Income
Per Capita Income Comparison
Malaysians
Immigrants from Australia
$39,194
PER CAPITA INCOME
0.7/ 100
METRIC RATING
259th/ 347
METRIC RANK
$57,953
PER CAPITA INCOME
100.0/ 100
METRIC RATING
4th/ 347
METRIC RANK
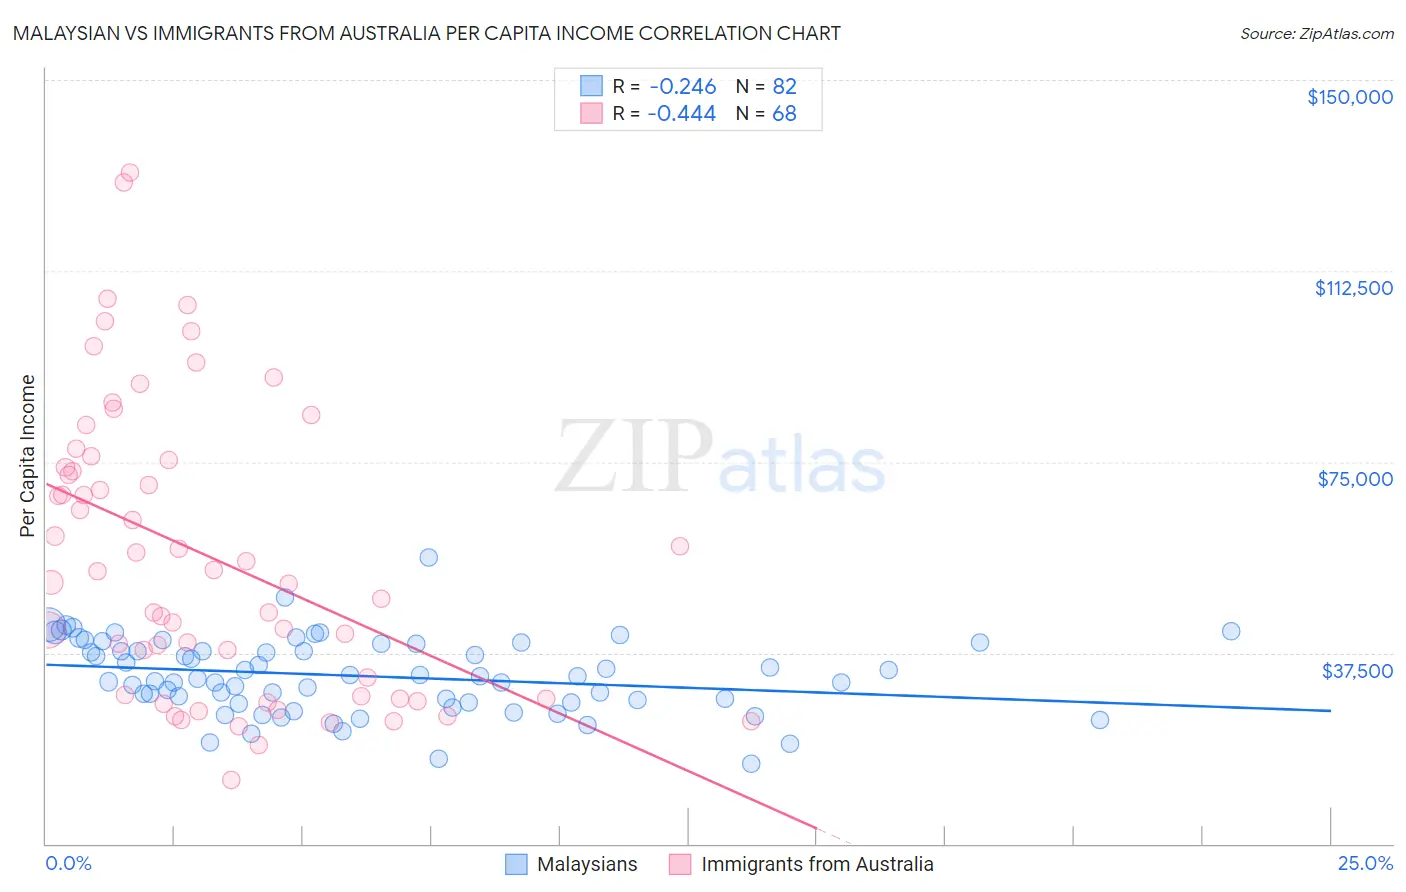
Malaysian vs Immigrants from Australia Per Capita Income Correlation Chart
The statistical analysis conducted on geographies consisting of 226,115,655 people shows a weak negative correlation between the proportion of Malaysians and per capita income in the United States with a correlation coefficient (R) of -0.246 and weighted average of $39,194. Similarly, the statistical analysis conducted on geographies consisting of 227,208,257 people shows a moderate negative correlation between the proportion of Immigrants from Australia and per capita income in the United States with a correlation coefficient (R) of -0.444 and weighted average of $57,953, a difference of 47.9%.
Per Capita Income Correlation Summary
| Measurement | Malaysian | Immigrants from Australia |
| Minimum | $15,753 | $12,597 |
| Maximum | $56,163 | $131,905 |
| Range | $40,410 | $119,308 |
| Mean | $32,947 | $56,529 |
| Median | $32,625 | $52,474 |
| Interquartile 25% (IQ1) | $27,821 | $28,994 |
| Interquartile 75% (IQ3) | $39,160 | $74,709 |
| Interquartile Range (IQR) | $11,339 | $45,716 |
| Standard Deviation (Sample) | $7,360 | $28,217 |
| Standard Deviation (Population) | $7,315 | $28,008 |
Similar Demographics by Per Capita Income
Demographics Similar to Malaysians by Per Capita Income
In terms of per capita income, the demographic groups most similar to Malaysians are Alaskan Athabascan ($39,163, a difference of 0.080%), Jamaican ($39,231, a difference of 0.090%), Marshallese ($39,108, a difference of 0.22%), Iroquois ($39,104, a difference of 0.23%), and Belizean ($39,097, a difference of 0.25%).
| Demographics | Rating | Rank | Per Capita Income |
| Immigrants | Azores | 1.0 /100 | #252 | Tragic $39,608 |
| Osage | 1.0 /100 | #253 | Tragic $39,568 |
| Alaska Natives | 1.0 /100 | #254 | Tragic $39,558 |
| Immigrants | Middle Africa | 1.0 /100 | #255 | Tragic $39,529 |
| Hawaiians | 0.8 /100 | #256 | Tragic $39,403 |
| Nicaraguans | 0.8 /100 | #257 | Tragic $39,372 |
| Jamaicans | 0.7 /100 | #258 | Tragic $39,231 |
| Malaysians | 0.7 /100 | #259 | Tragic $39,194 |
| Alaskan Athabascans | 0.6 /100 | #260 | Tragic $39,163 |
| Marshallese | 0.6 /100 | #261 | Tragic $39,108 |
| Iroquois | 0.6 /100 | #262 | Tragic $39,104 |
| Belizeans | 0.6 /100 | #263 | Tragic $39,097 |
| Americans | 0.6 /100 | #264 | Tragic $39,039 |
| Spanish Americans | 0.5 /100 | #265 | Tragic $39,012 |
| Salvadorans | 0.5 /100 | #266 | Tragic $38,858 |
Demographics Similar to Immigrants from Australia by Per Capita Income
In terms of per capita income, the demographic groups most similar to Immigrants from Australia are Immigrants from Iran ($57,759, a difference of 0.34%), Immigrants from Taiwan ($57,742, a difference of 0.37%), Immigrants from Singapore ($58,353, a difference of 0.69%), Immigrants from Israel ($57,384, a difference of 0.99%), and Iranian ($58,786, a difference of 1.4%).
| Demographics | Rating | Rank | Per Capita Income |
| Filipinos | 100.0 /100 | #1 | Exceptional $59,066 |
| Iranians | 100.0 /100 | #2 | Exceptional $58,786 |
| Immigrants | Singapore | 100.0 /100 | #3 | Exceptional $58,353 |
| Immigrants | Australia | 100.0 /100 | #4 | Exceptional $57,953 |
| Immigrants | Iran | 100.0 /100 | #5 | Exceptional $57,759 |
| Immigrants | Taiwan | 100.0 /100 | #6 | Exceptional $57,742 |
| Immigrants | Israel | 100.0 /100 | #7 | Exceptional $57,384 |
| Immigrants | Hong Kong | 100.0 /100 | #8 | Exceptional $56,709 |
| Immigrants | Ireland | 100.0 /100 | #9 | Exceptional $56,584 |
| Okinawans | 100.0 /100 | #10 | Exceptional $55,817 |
| Eastern Europeans | 100.0 /100 | #11 | Exceptional $55,780 |
| Immigrants | Sweden | 100.0 /100 | #12 | Exceptional $55,582 |
| Immigrants | India | 100.0 /100 | #13 | Exceptional $55,268 |
| Immigrants | Belgium | 100.0 /100 | #14 | Exceptional $55,082 |
| Cypriots | 100.0 /100 | #15 | Exceptional $54,899 |