Malaysian vs Turkish Per Capita Income
COMPARE
Malaysian
Turkish
Per Capita Income
Per Capita Income Comparison
Malaysians
Turks
$39,194
PER CAPITA INCOME
0.7/ 100
METRIC RATING
259th/ 347
METRIC RANK
$52,391
PER CAPITA INCOME
100.0/ 100
METRIC RATING
31st/ 347
METRIC RANK
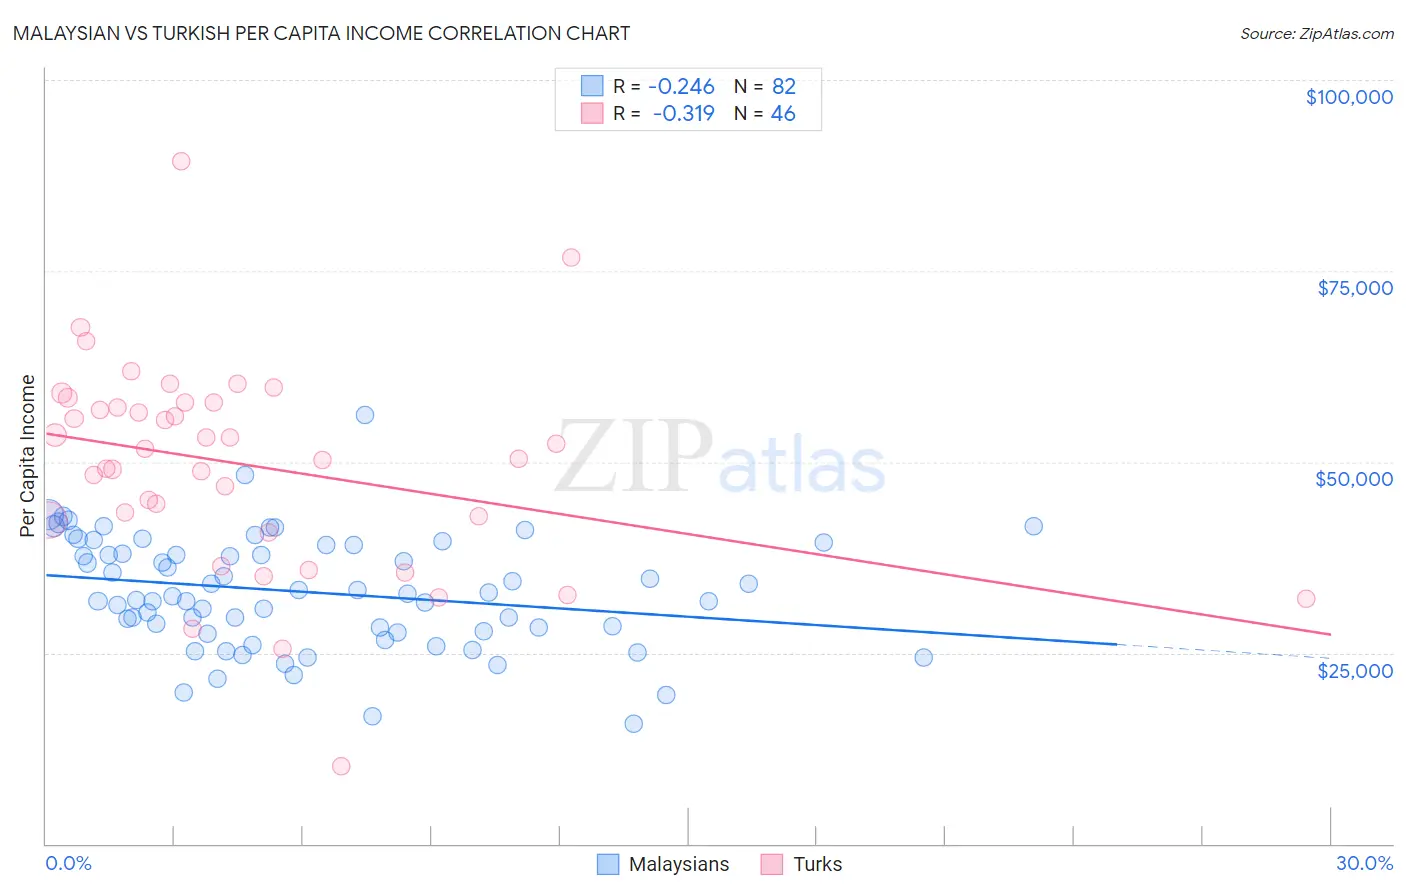
Malaysian vs Turkish Per Capita Income Correlation Chart
The statistical analysis conducted on geographies consisting of 226,115,655 people shows a weak negative correlation between the proportion of Malaysians and per capita income in the United States with a correlation coefficient (R) of -0.246 and weighted average of $39,194. Similarly, the statistical analysis conducted on geographies consisting of 271,859,983 people shows a mild negative correlation between the proportion of Turks and per capita income in the United States with a correlation coefficient (R) of -0.319 and weighted average of $52,391, a difference of 33.7%.
Per Capita Income Correlation Summary
| Measurement | Malaysian | Turkish |
| Minimum | $15,753 | $10,169 |
| Maximum | $56,163 | $89,333 |
| Range | $40,410 | $79,164 |
| Mean | $32,947 | $49,588 |
| Median | $32,625 | $51,043 |
| Interquartile 25% (IQ1) | $27,821 | $42,405 |
| Interquartile 75% (IQ3) | $39,160 | $57,708 |
| Interquartile Range (IQR) | $11,339 | $15,302 |
| Standard Deviation (Sample) | $7,360 | $13,772 |
| Standard Deviation (Population) | $7,315 | $13,621 |
Similar Demographics by Per Capita Income
Demographics Similar to Malaysians by Per Capita Income
In terms of per capita income, the demographic groups most similar to Malaysians are Alaskan Athabascan ($39,163, a difference of 0.080%), Jamaican ($39,231, a difference of 0.090%), Marshallese ($39,108, a difference of 0.22%), Iroquois ($39,104, a difference of 0.23%), and Belizean ($39,097, a difference of 0.25%).
| Demographics | Rating | Rank | Per Capita Income |
| Immigrants | Azores | 1.0 /100 | #252 | Tragic $39,608 |
| Osage | 1.0 /100 | #253 | Tragic $39,568 |
| Alaska Natives | 1.0 /100 | #254 | Tragic $39,558 |
| Immigrants | Middle Africa | 1.0 /100 | #255 | Tragic $39,529 |
| Hawaiians | 0.8 /100 | #256 | Tragic $39,403 |
| Nicaraguans | 0.8 /100 | #257 | Tragic $39,372 |
| Jamaicans | 0.7 /100 | #258 | Tragic $39,231 |
| Malaysians | 0.7 /100 | #259 | Tragic $39,194 |
| Alaskan Athabascans | 0.6 /100 | #260 | Tragic $39,163 |
| Marshallese | 0.6 /100 | #261 | Tragic $39,108 |
| Iroquois | 0.6 /100 | #262 | Tragic $39,104 |
| Belizeans | 0.6 /100 | #263 | Tragic $39,097 |
| Americans | 0.6 /100 | #264 | Tragic $39,039 |
| Spanish Americans | 0.5 /100 | #265 | Tragic $39,012 |
| Salvadorans | 0.5 /100 | #266 | Tragic $38,858 |
Demographics Similar to Turks by Per Capita Income
In terms of per capita income, the demographic groups most similar to Turks are Immigrants from Austria ($52,503, a difference of 0.21%), Immigrants from Norway ($52,217, a difference of 0.33%), Israeli ($52,596, a difference of 0.39%), Latvian ($52,649, a difference of 0.49%), and Immigrants from South Central Asia ($52,660, a difference of 0.51%).
| Demographics | Rating | Rank | Per Capita Income |
| Immigrants | Denmark | 100.0 /100 | #24 | Exceptional $53,799 |
| Immigrants | Japan | 100.0 /100 | #25 | Exceptional $53,359 |
| Russians | 100.0 /100 | #26 | Exceptional $53,154 |
| Immigrants | South Central Asia | 100.0 /100 | #27 | Exceptional $52,660 |
| Latvians | 100.0 /100 | #28 | Exceptional $52,649 |
| Israelis | 100.0 /100 | #29 | Exceptional $52,596 |
| Immigrants | Austria | 100.0 /100 | #30 | Exceptional $52,503 |
| Turks | 100.0 /100 | #31 | Exceptional $52,391 |
| Immigrants | Norway | 100.0 /100 | #32 | Exceptional $52,217 |
| Australians | 100.0 /100 | #33 | Exceptional $52,074 |
| Immigrants | Russia | 100.0 /100 | #34 | Exceptional $52,044 |
| Burmese | 100.0 /100 | #35 | Exceptional $52,005 |
| Immigrants | Greece | 100.0 /100 | #36 | Exceptional $51,891 |
| Estonians | 100.0 /100 | #37 | Exceptional $51,875 |
| Immigrants | Czechoslovakia | 100.0 /100 | #38 | Exceptional $51,770 |