Malaysian vs Ukrainian Per Capita Income
COMPARE
Malaysian
Ukrainian
Per Capita Income
Per Capita Income Comparison
Malaysians
Ukrainians
$39,194
PER CAPITA INCOME
0.7/ 100
METRIC RATING
259th/ 347
METRIC RANK
$48,014
PER CAPITA INCOME
99.3/ 100
METRIC RATING
87th/ 347
METRIC RANK
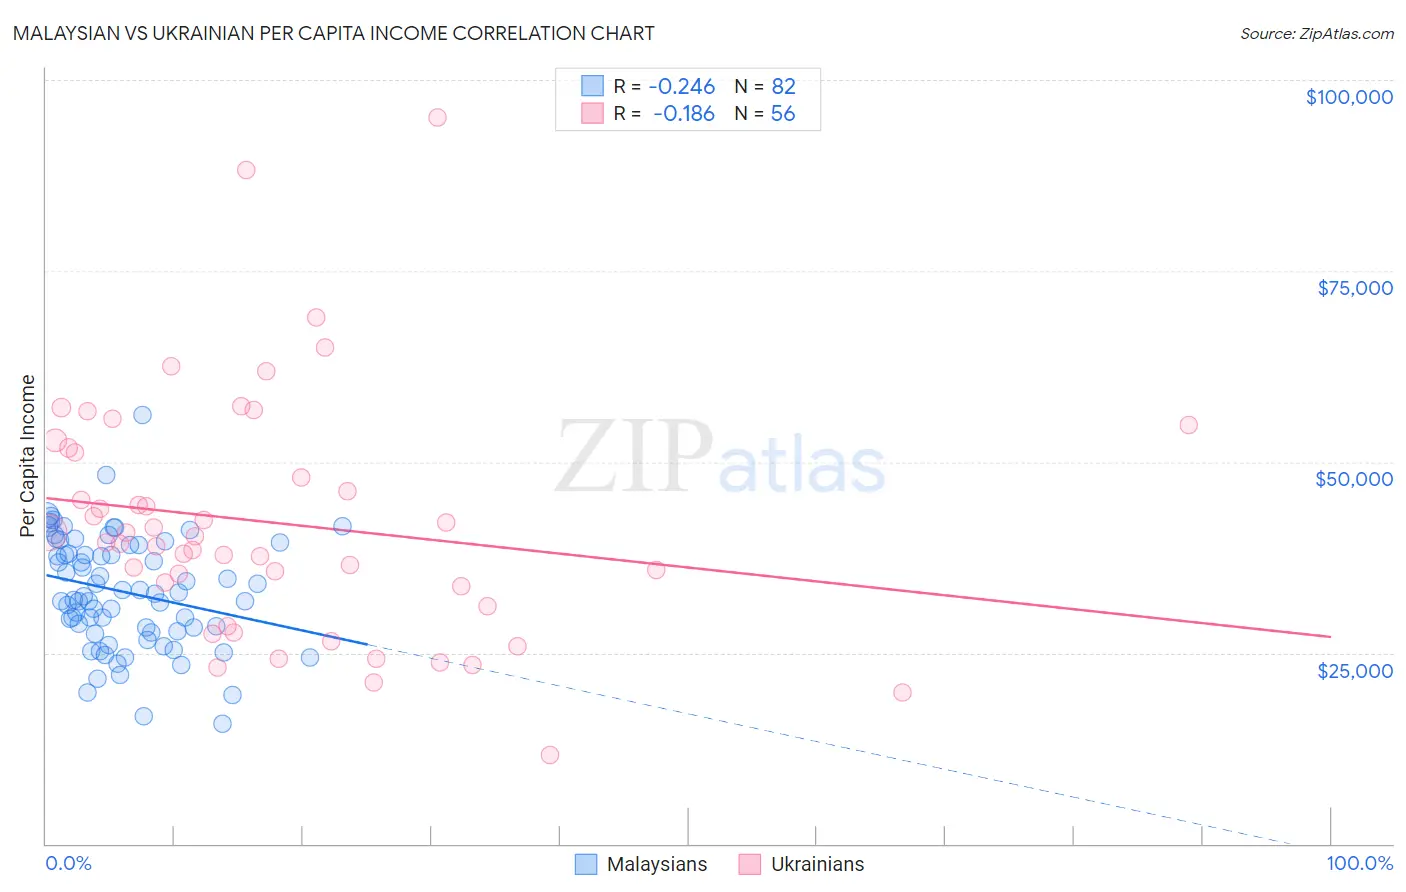
Malaysian vs Ukrainian Per Capita Income Correlation Chart
The statistical analysis conducted on geographies consisting of 226,115,655 people shows a weak negative correlation between the proportion of Malaysians and per capita income in the United States with a correlation coefficient (R) of -0.246 and weighted average of $39,194. Similarly, the statistical analysis conducted on geographies consisting of 448,721,179 people shows a poor negative correlation between the proportion of Ukrainians and per capita income in the United States with a correlation coefficient (R) of -0.186 and weighted average of $48,014, a difference of 22.5%.
Per Capita Income Correlation Summary
| Measurement | Malaysian | Ukrainian |
| Minimum | $15,753 | $11,586 |
| Maximum | $56,163 | $95,117 |
| Range | $40,410 | $83,531 |
| Mean | $32,947 | $42,023 |
| Median | $32,625 | $39,896 |
| Interquartile 25% (IQ1) | $27,821 | $32,403 |
| Interquartile 75% (IQ3) | $39,160 | $51,527 |
| Interquartile Range (IQR) | $11,339 | $19,124 |
| Standard Deviation (Sample) | $7,360 | $15,846 |
| Standard Deviation (Population) | $7,315 | $15,703 |
Similar Demographics by Per Capita Income
Demographics Similar to Malaysians by Per Capita Income
In terms of per capita income, the demographic groups most similar to Malaysians are Alaskan Athabascan ($39,163, a difference of 0.080%), Jamaican ($39,231, a difference of 0.090%), Marshallese ($39,108, a difference of 0.22%), Iroquois ($39,104, a difference of 0.23%), and Belizean ($39,097, a difference of 0.25%).
| Demographics | Rating | Rank | Per Capita Income |
| Immigrants | Azores | 1.0 /100 | #252 | Tragic $39,608 |
| Osage | 1.0 /100 | #253 | Tragic $39,568 |
| Alaska Natives | 1.0 /100 | #254 | Tragic $39,558 |
| Immigrants | Middle Africa | 1.0 /100 | #255 | Tragic $39,529 |
| Hawaiians | 0.8 /100 | #256 | Tragic $39,403 |
| Nicaraguans | 0.8 /100 | #257 | Tragic $39,372 |
| Jamaicans | 0.7 /100 | #258 | Tragic $39,231 |
| Malaysians | 0.7 /100 | #259 | Tragic $39,194 |
| Alaskan Athabascans | 0.6 /100 | #260 | Tragic $39,163 |
| Marshallese | 0.6 /100 | #261 | Tragic $39,108 |
| Iroquois | 0.6 /100 | #262 | Tragic $39,104 |
| Belizeans | 0.6 /100 | #263 | Tragic $39,097 |
| Americans | 0.6 /100 | #264 | Tragic $39,039 |
| Spanish Americans | 0.5 /100 | #265 | Tragic $39,012 |
| Salvadorans | 0.5 /100 | #266 | Tragic $38,858 |
Demographics Similar to Ukrainians by Per Capita Income
In terms of per capita income, the demographic groups most similar to Ukrainians are Immigrants from Southern Europe ($48,027, a difference of 0.030%), Austrian ($48,116, a difference of 0.21%), Immigrants from Ukraine ($48,134, a difference of 0.25%), Immigrants from Brazil ($48,164, a difference of 0.31%), and Immigrants from Indonesia ($48,195, a difference of 0.38%).
| Demographics | Rating | Rank | Per Capita Income |
| Egyptians | 99.5 /100 | #80 | Exceptional $48,358 |
| Armenians | 99.4 /100 | #81 | Exceptional $48,287 |
| Immigrants | Indonesia | 99.4 /100 | #82 | Exceptional $48,195 |
| Immigrants | Brazil | 99.4 /100 | #83 | Exceptional $48,164 |
| Immigrants | Ukraine | 99.3 /100 | #84 | Exceptional $48,134 |
| Austrians | 99.3 /100 | #85 | Exceptional $48,116 |
| Immigrants | Southern Europe | 99.3 /100 | #86 | Exceptional $48,027 |
| Ukrainians | 99.3 /100 | #87 | Exceptional $48,014 |
| Croatians | 99.0 /100 | #88 | Exceptional $47,742 |
| Northern Europeans | 98.9 /100 | #89 | Exceptional $47,698 |
| Italians | 98.8 /100 | #90 | Exceptional $47,574 |
| Macedonians | 98.8 /100 | #91 | Exceptional $47,573 |
| Immigrants | Moldova | 98.7 /100 | #92 | Exceptional $47,489 |
| Immigrants | Zimbabwe | 98.5 /100 | #93 | Exceptional $47,394 |
| Albanians | 98.5 /100 | #94 | Exceptional $47,379 |