Malaysian vs Immigrants from Serbia Cognitive Disability
COMPARE
Malaysian
Immigrants from Serbia
Cognitive Disability
Cognitive Disability Comparison
Malaysians
Immigrants from Serbia
17.9%
COGNITIVE DISABILITY
0.6/ 100
METRIC RATING
251st/ 347
METRIC RANK
16.7%
COGNITIVE DISABILITY
99.3/ 100
METRIC RATING
76th/ 347
METRIC RANK
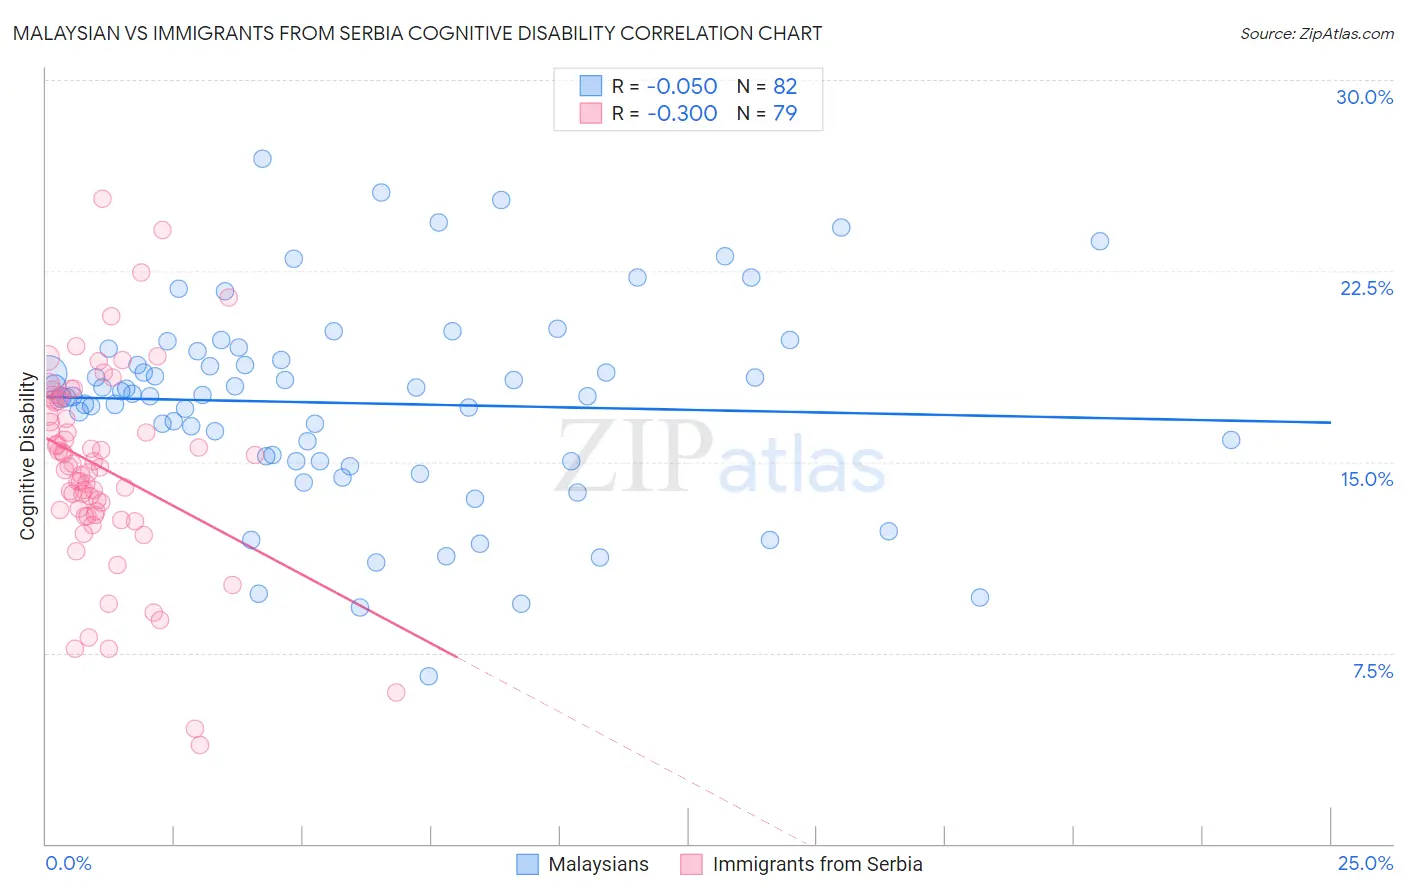
Malaysian vs Immigrants from Serbia Cognitive Disability Correlation Chart
The statistical analysis conducted on geographies consisting of 226,070,316 people shows a slight negative correlation between the proportion of Malaysians and percentage of population with cognitive disability in the United States with a correlation coefficient (R) of -0.050 and weighted average of 17.9%. Similarly, the statistical analysis conducted on geographies consisting of 131,747,829 people shows a mild negative correlation between the proportion of Immigrants from Serbia and percentage of population with cognitive disability in the United States with a correlation coefficient (R) of -0.300 and weighted average of 16.7%, a difference of 7.4%.
Cognitive Disability Correlation Summary
| Measurement | Malaysian | Immigrants from Serbia |
| Minimum | 6.6% | 3.9% |
| Maximum | 26.9% | 25.3% |
| Range | 20.3% | 21.5% |
| Mean | 17.3% | 14.8% |
| Median | 17.6% | 14.9% |
| Interquartile 25% (IQ1) | 15.0% | 12.9% |
| Interquartile 75% (IQ3) | 19.3% | 17.4% |
| Interquartile Range (IQR) | 4.3% | 4.5% |
| Standard Deviation (Sample) | 4.0% | 3.9% |
| Standard Deviation (Population) | 3.9% | 3.9% |
Similar Demographics by Cognitive Disability
Demographics Similar to Malaysians by Cognitive Disability
In terms of cognitive disability, the demographic groups most similar to Malaysians are Cree (17.9%, a difference of 0.010%), Immigrants from Ethiopia (17.9%, a difference of 0.010%), Immigrants from Grenada (17.9%, a difference of 0.010%), Hopi (17.9%, a difference of 0.030%), and Hispanic or Latino (17.9%, a difference of 0.030%).
| Demographics | Rating | Rank | Cognitive Disability |
| Jamaicans | 0.9 /100 | #244 | Tragic 17.9% |
| Trinidadians and Tobagonians | 0.8 /100 | #245 | Tragic 17.9% |
| Immigrants | Thailand | 0.8 /100 | #246 | Tragic 17.9% |
| Samoans | 0.7 /100 | #247 | Tragic 17.9% |
| French American Indians | 0.7 /100 | #248 | Tragic 17.9% |
| Cree | 0.7 /100 | #249 | Tragic 17.9% |
| Immigrants | Ethiopia | 0.7 /100 | #250 | Tragic 17.9% |
| Malaysians | 0.6 /100 | #251 | Tragic 17.9% |
| Immigrants | Grenada | 0.6 /100 | #252 | Tragic 17.9% |
| Hopi | 0.6 /100 | #253 | Tragic 17.9% |
| Hispanics or Latinos | 0.6 /100 | #254 | Tragic 17.9% |
| Immigrants | Azores | 0.6 /100 | #255 | Tragic 17.9% |
| Bahamians | 0.6 /100 | #256 | Tragic 17.9% |
| Mexican American Indians | 0.6 /100 | #257 | Tragic 17.9% |
| Immigrants | Armenia | 0.6 /100 | #258 | Tragic 17.9% |
Demographics Similar to Immigrants from Serbia by Cognitive Disability
In terms of cognitive disability, the demographic groups most similar to Immigrants from Serbia are Immigrants from Hungary (16.7%, a difference of 0.010%), Peruvian (16.7%, a difference of 0.010%), Estonian (16.7%, a difference of 0.020%), Immigrants from Bulgaria (16.7%, a difference of 0.020%), and Burmese (16.7%, a difference of 0.030%).
| Demographics | Rating | Rank | Cognitive Disability |
| Immigrants | Uzbekistan | 99.4 /100 | #69 | Exceptional 16.7% |
| Immigrants | Sweden | 99.4 /100 | #70 | Exceptional 16.7% |
| Immigrants | Belgium | 99.3 /100 | #71 | Exceptional 16.7% |
| Germans | 99.3 /100 | #72 | Exceptional 16.7% |
| Burmese | 99.3 /100 | #73 | Exceptional 16.7% |
| Slavs | 99.3 /100 | #74 | Exceptional 16.7% |
| Estonians | 99.3 /100 | #75 | Exceptional 16.7% |
| Immigrants | Serbia | 99.3 /100 | #76 | Exceptional 16.7% |
| Immigrants | Hungary | 99.3 /100 | #77 | Exceptional 16.7% |
| Peruvians | 99.3 /100 | #78 | Exceptional 16.7% |
| Immigrants | Bulgaria | 99.3 /100 | #79 | Exceptional 16.7% |
| Egyptians | 99.2 /100 | #80 | Exceptional 16.7% |
| Immigrants | Netherlands | 99.2 /100 | #81 | Exceptional 16.7% |
| Swiss | 99.2 /100 | #82 | Exceptional 16.7% |
| Serbians | 99.1 /100 | #83 | Exceptional 16.7% |